
Pharmaceutical company Organon (NYSE: OGN) reported Q3 CY2025 results exceeding the market’s revenue expectations, with sales up 1.3% year on year to $1.60 billion. On the other hand, the company’s full-year revenue guidance of $6.23 billion at the midpoint came in 1% below analysts’ estimates. Its non-GAAP profit of $1.01 per share was 8.5% above analysts’ consensus estimates.
Is now the time to buy Organon? Find out by accessing our full research report, it’s free for active Edge members.
Organon (OGN) Q3 CY2025 Highlights:
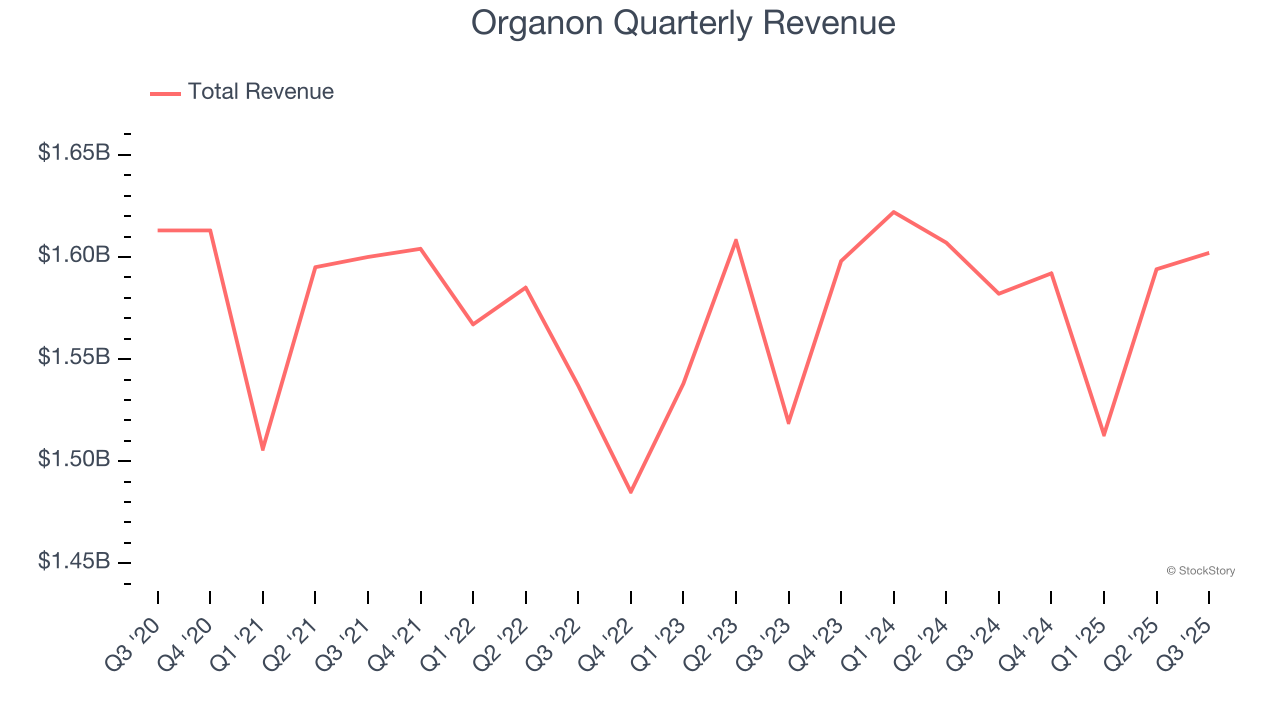
- Revenue: $1.60 billion vs analyst estimates of $1.57 billion (1.3% year-on-year growth, 2% beat)
- Adjusted EPS: $1.01 vs analyst estimates of $0.93 (8.5% beat)
- Adjusted EBITDA: $518 million vs analyst estimates of $480 million (32.3% margin, 7.9% beat)
- The company reconfirmed its revenue guidance for the full year of $6.23 billion at the midpoint
- Operating Margin: 15.2%, down from 21.4% in the same quarter last year
- Market Capitalization: $1.76 billion
“I am humbled to be working alongside our talented team during this pivotal time for Organon,” said Joe Morrissey, Organon’s Interim Chief Executive Officer.
Company Overview
Spun off from Merck in 2021 to create a company dedicated to addressing unmet needs in women's health, Organon (NYSE: OGN) is a global healthcare company focused on improving women's health through prescription therapies, medical devices, biosimilars, and established medicines.
Revenue Growth
Examining a company’s long-term performance can provide clues about its quality. Any business can have short-term success, but a top-tier one grows for years. Over the last five years, Organon’s demand was weak and its revenue declined by 1.7% per year. This wasn’t a great result and is a sign of lacking business quality.
Long-term growth is the most important, but within healthcare, a half-decade historical view may miss new innovations or demand cycles. Organon’s annualized revenue growth of 1.2% over the last two years is above its five-year trend, but we were still disappointed by the results. 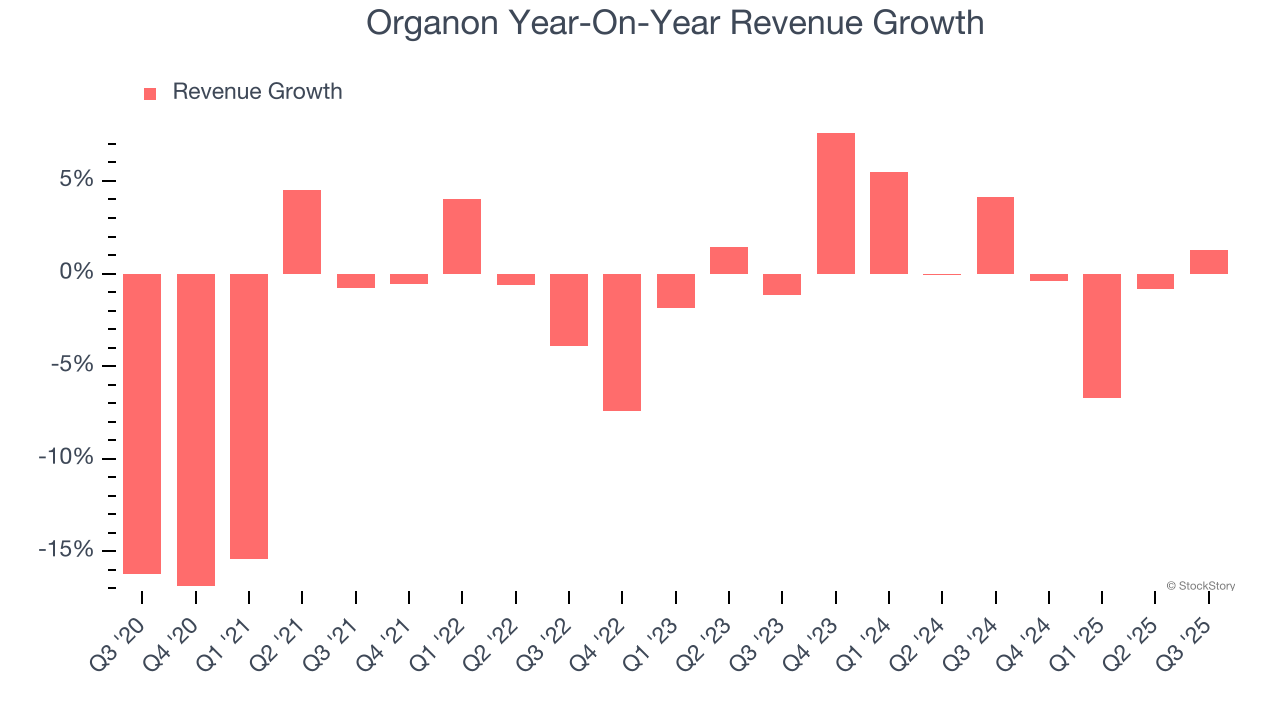
This quarter, Organon reported modest year-on-year revenue growth of 1.3% but beat Wall Street’s estimates by 2%.
Looking ahead, sell-side analysts expect revenue to remain flat over the next 12 months, a slight deceleration versus the last two years. This projection doesn't excite us and indicates its products and services will see some demand headwinds.
Software is eating the world and there is virtually no industry left that has been untouched by it. That drives increasing demand for tools helping software developers do their jobs, whether it be monitoring critical cloud infrastructure, integrating audio and video functionality, or ensuring smooth content streaming. Click here to access a free report on our 3 favorite stocks to play this generational megatrend.
Operating Margin
Operating margin is an important measure of profitability as it shows the portion of revenue left after accounting for all core expenses – everything from the cost of goods sold to advertising and wages. It’s also useful for comparing profitability across companies with different levels of debt and tax rates because it excludes interest and taxes.
Organon has been an efficient company over the last five years. It was one of the more profitable businesses in the healthcare sector, boasting an average operating margin of 23.3%.
Looking at the trend in its profitability, Organon’s operating margin decreased by 14.3 percentage points over the last five years. The company’s two-year trajectory also shows it failed to get its profitability back to the peak as its margin fell by 3.3 percentage points. This performance was poor no matter how you look at it - it shows its expenses were rising and it couldn’t pass those costs onto its customers.
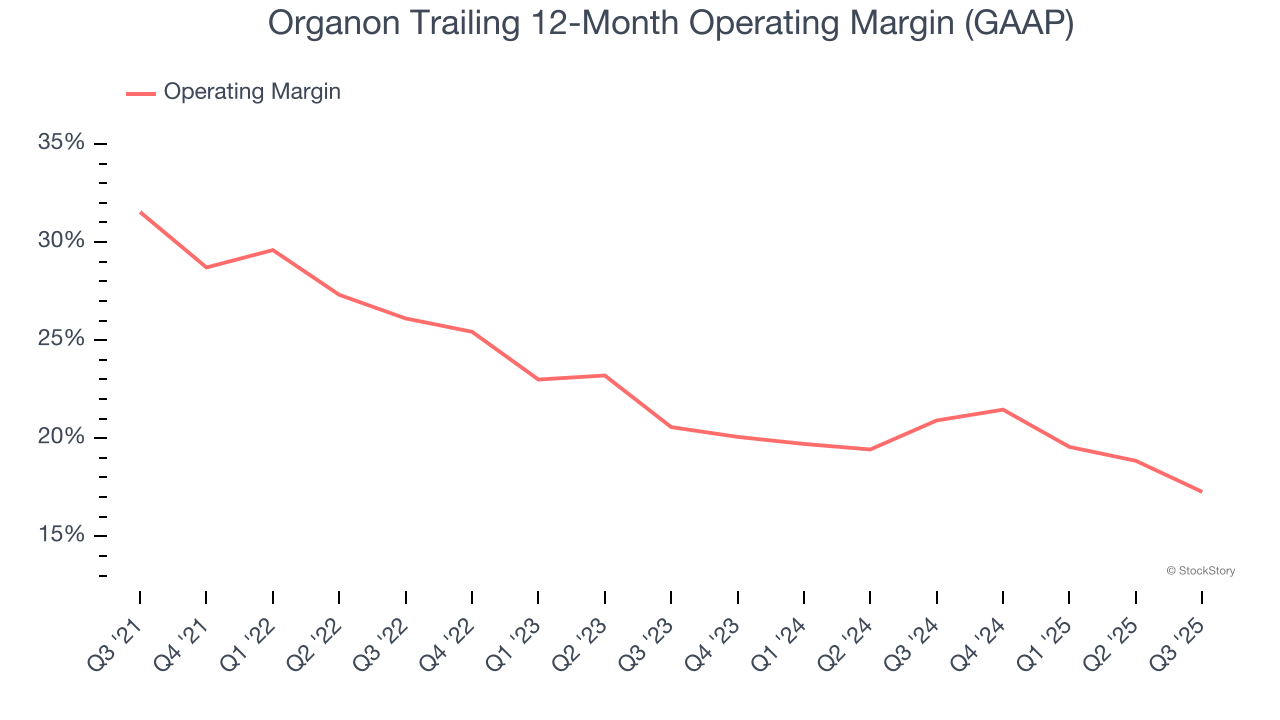
This quarter, Organon generated an operating margin profit margin of 15.2%, down 6.3 percentage points year on year. This contraction shows it was less efficient because its expenses grew faster than its revenue.
Earnings Per Share
We track the long-term change in earnings per share (EPS) for the same reason as long-term revenue growth. Compared to revenue, however, EPS highlights whether a company’s growth is profitable.
Sadly for Organon, its EPS declined by 17.6% annually over the last five years, more than its revenue. This tells us the company struggled because its fixed cost base made it difficult to adjust to shrinking demand.
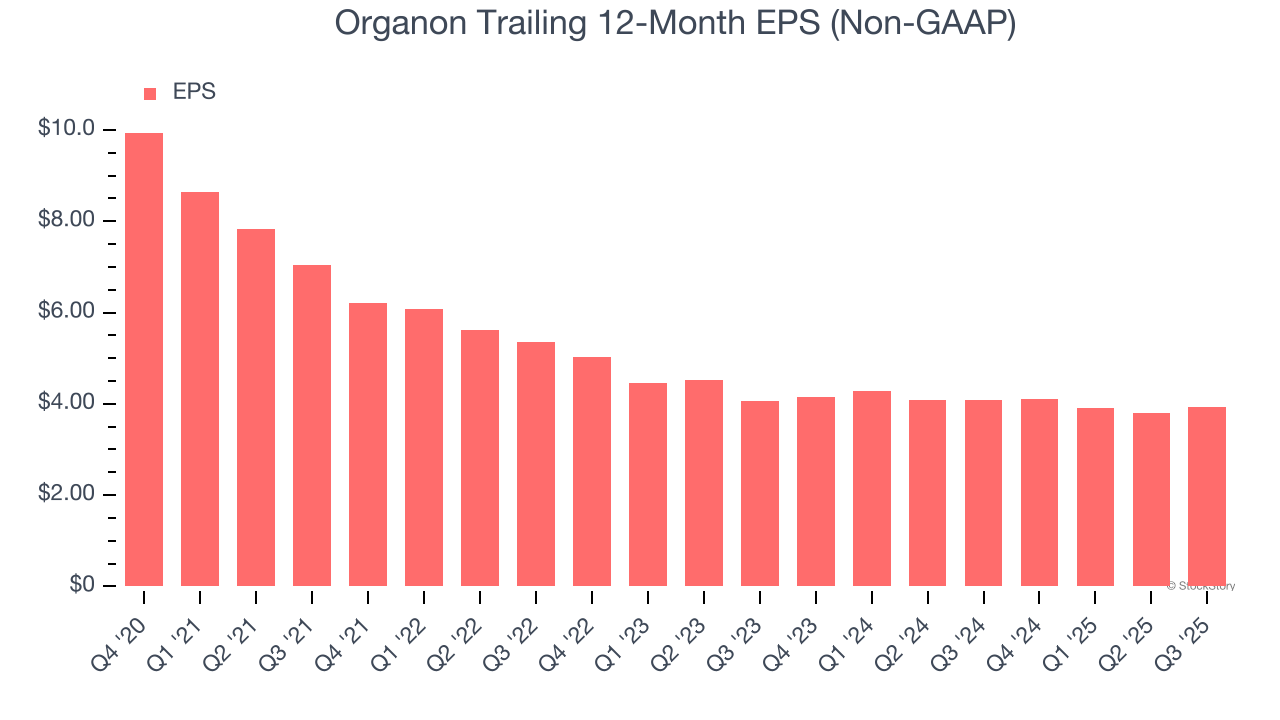
We can take a deeper look into Organon’s earnings to better understand the drivers of its performance. As we mentioned earlier, Organon’s operating margin declined by 14.3 percentage points over the last five years. This was the most relevant factor (aside from the revenue impact) behind its lower earnings; interest expenses and taxes can also affect EPS but don’t tell us as much about a company’s fundamentals.
In Q3, Organon reported adjusted EPS of $1.01, up from $0.87 in the same quarter last year. This print beat analysts’ estimates by 8.5%. Over the next 12 months, Wall Street expects Organon’s full-year EPS of $3.93 to shrink by 2.6%.
Key Takeaways from Organon’s Q3 Results
It was encouraging to see Organon beat analysts’ revenue expectations this quarter. We were also glad its EPS outperformed Wall Street’s estimates. Looking ahead, its full-year revenue guidance was reaffirmed. Zooming out, we think this was a decent quarter. The stock traded up 2.9% to $6.98 immediately after reporting.
Is Organon an attractive investment opportunity at the current price? The latest quarter does matter, but not nearly as much as longer-term fundamentals and valuation, when deciding if the stock is a buy. We cover that in our actionable full research report which you can read here, it’s free for active Edge members.