
Energy recovery device manufacturer Energy Recovery (NASDAQ: ERII) reported Q3 CY2025 results topping the market’s revenue expectations, but sales fell by 17.1% year on year to $32 million. Its non-GAAP profit of $0.12 per share was 24.1% above analysts’ consensus estimates.
Is now the time to buy Energy Recovery? Find out by accessing our full research report, it’s free for active Edge members.
Energy Recovery (ERII) Q3 CY2025 Highlights:
- Revenue: $32 million vs analyst estimates of $29.94 million (17.1% year-on-year decline, 6.9% beat)
- Adjusted EPS: $0.12 vs analyst estimates of $0.10 (24.1% beat)
- Adjusted EBITDA: $6.8 million vs analyst estimates of $7.21 million (21.3% margin, 5.7% miss)
- Operating Margin: 11.4%, down from 18.3% in the same quarter last year
- Free Cash Flow was -$3.5 million compared to -$3.17 million in the same quarter last year
- Market Capitalization: $873 million
Company Overview
Having saved far more than a trillion gallons of water, Energy Recovery (NASDAQ: ERII) provides energy recovery devices to the water treatment, oil and gas, and chemical processing sectors.
Revenue Growth
Reviewing a company’s long-term sales performance reveals insights into its quality. Any business can experience short-term success, but top-performing ones enjoy sustained growth for years. Unfortunately, Energy Recovery’s 3.8% annualized revenue growth over the last five years was sluggish. This wasn’t a great result compared to the rest of the industrials sector, but there are still things to like about Energy Recovery.
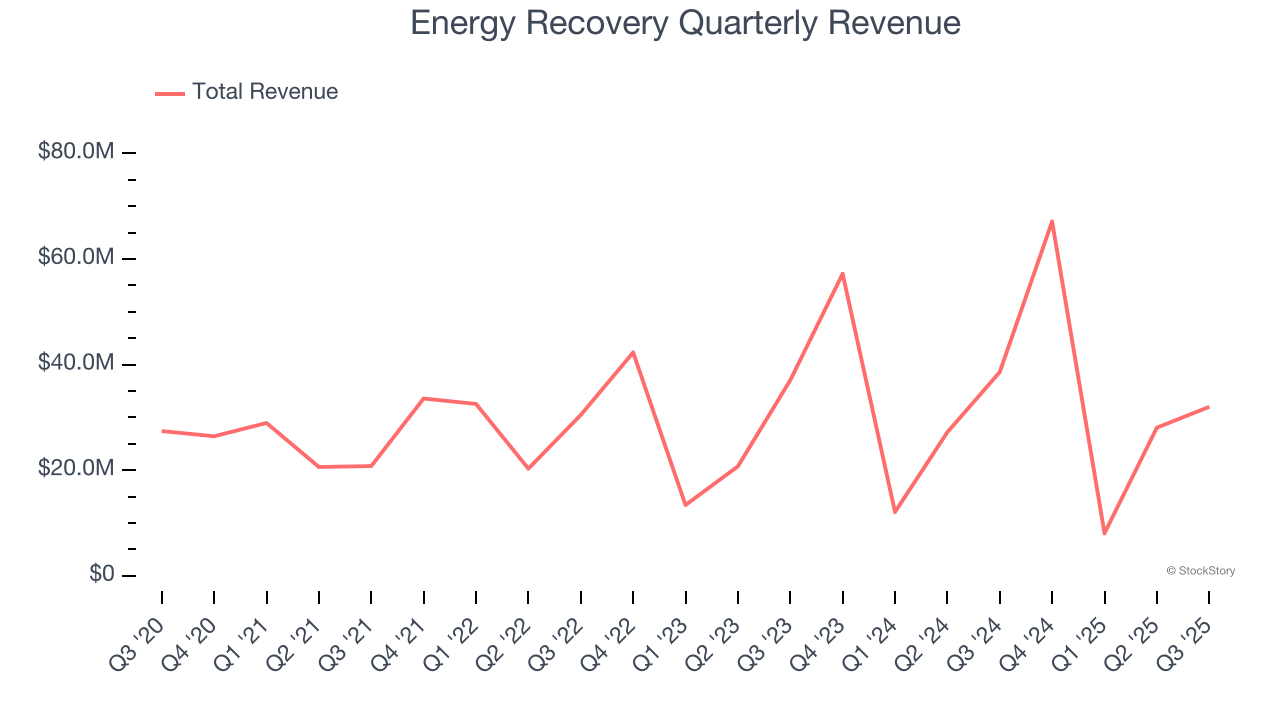
We at StockStory place the most emphasis on long-term growth, but within industrials, a half-decade historical view may miss cycles, industry trends, or a company capitalizing on catalysts such as a new contract win or a successful product line. Energy Recovery’s annualized revenue growth of 9.2% over the last two years is above its five-year trend, suggesting its demand recently accelerated. 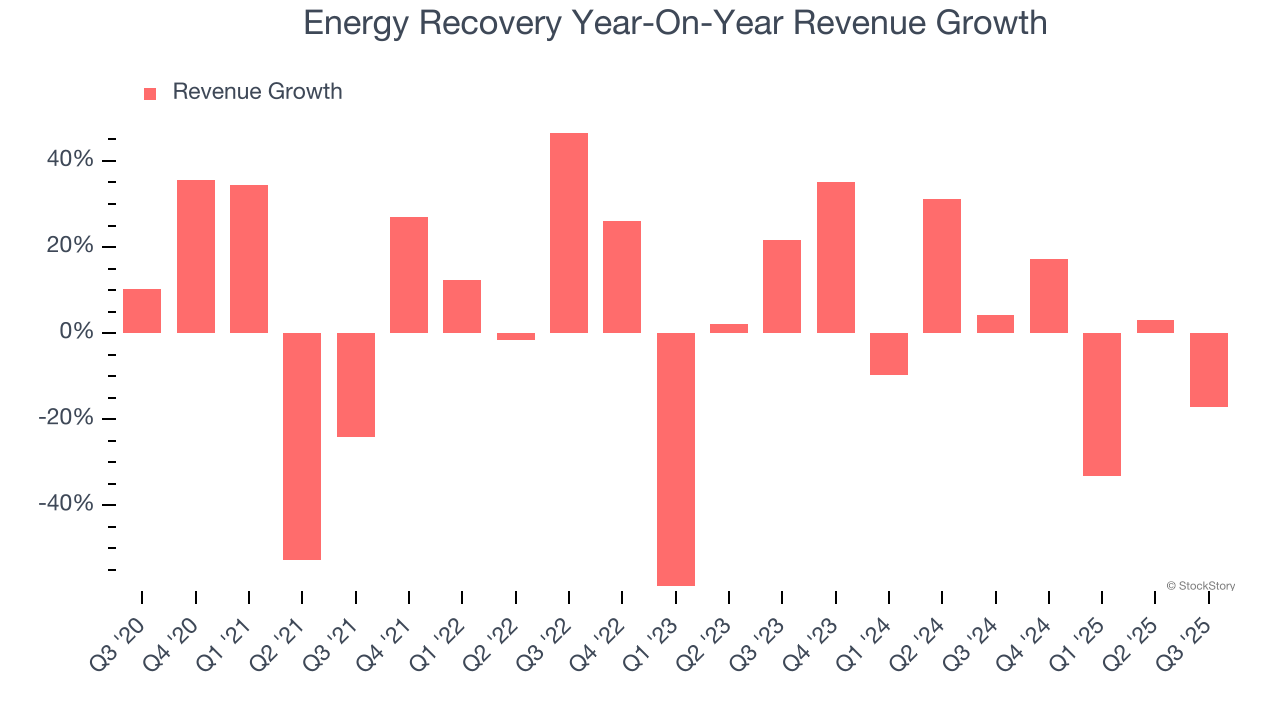
This quarter, Energy Recovery’s revenue fell by 17.1% year on year to $32 million but beat Wall Street’s estimates by 6.9%.
Looking ahead, sell-side analysts expect revenue to grow 31.1% over the next 12 months, an improvement versus the last two years. This projection is eye-popping and implies its newer products and services will spur better top-line performance.
While Wall Street chases Nvidia at all-time highs, an under-the-radar semiconductor supplier is dominating a critical AI component these giants can’t build without. Click here to access our free report one of our favorites growth stories.
Operating Margin
Operating margin is a key measure of profitability. Think of it as net income - the bottom line - excluding the impact of taxes and interest on debt, which are less connected to business fundamentals.
Energy Recovery has been an efficient company over the last five years. It was one of the more profitable businesses in the industrials sector, boasting an average operating margin of 12.9%. This result isn’t surprising as its high gross margin gives it a favorable starting point.
Looking at the trend in its profitability, Energy Recovery’s operating margin rose by 3.6 percentage points over the last five years, as its sales growth gave it operating leverage.
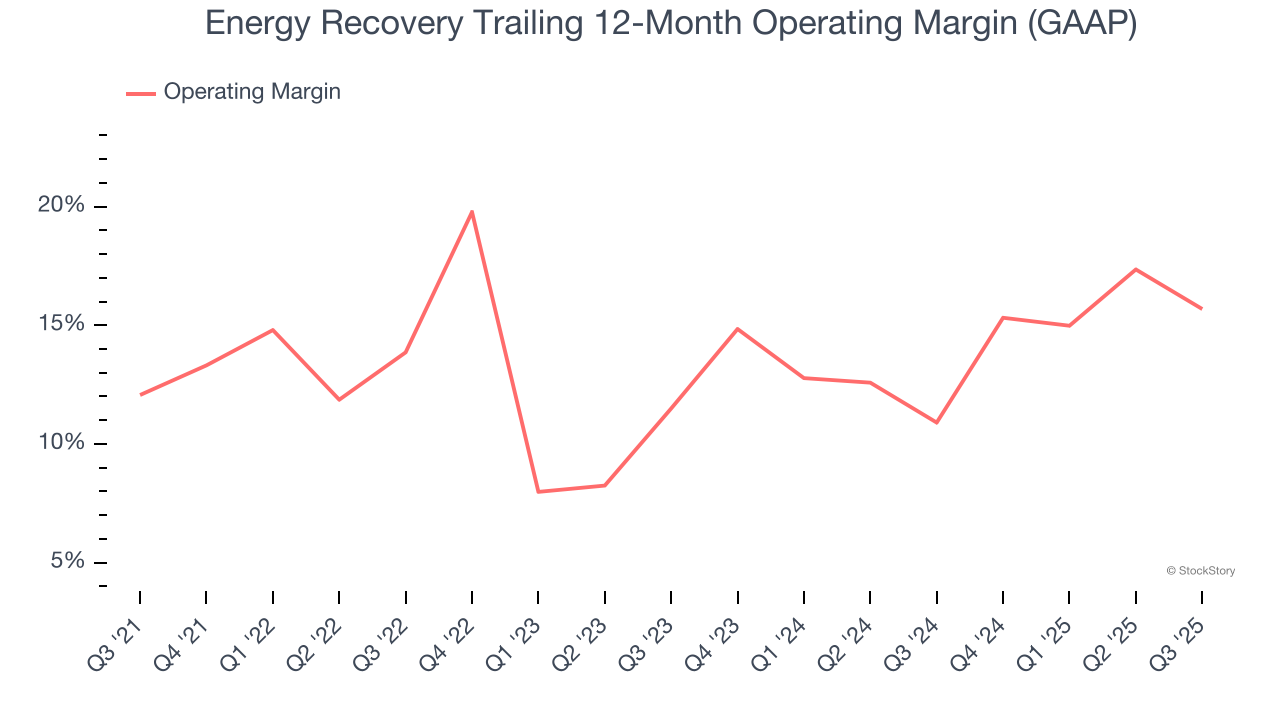
In Q3, Energy Recovery generated an operating margin profit margin of 11.4%, down 6.8 percentage points year on year. Since Energy Recovery’s operating margin decreased more than its gross margin, we can assume it was less efficient because expenses such as marketing, R&D, and administrative overhead increased.
Earnings Per Share
We track the long-term change in earnings per share (EPS) for the same reason as long-term revenue growth. Compared to revenue, however, EPS highlights whether a company’s growth is profitable.
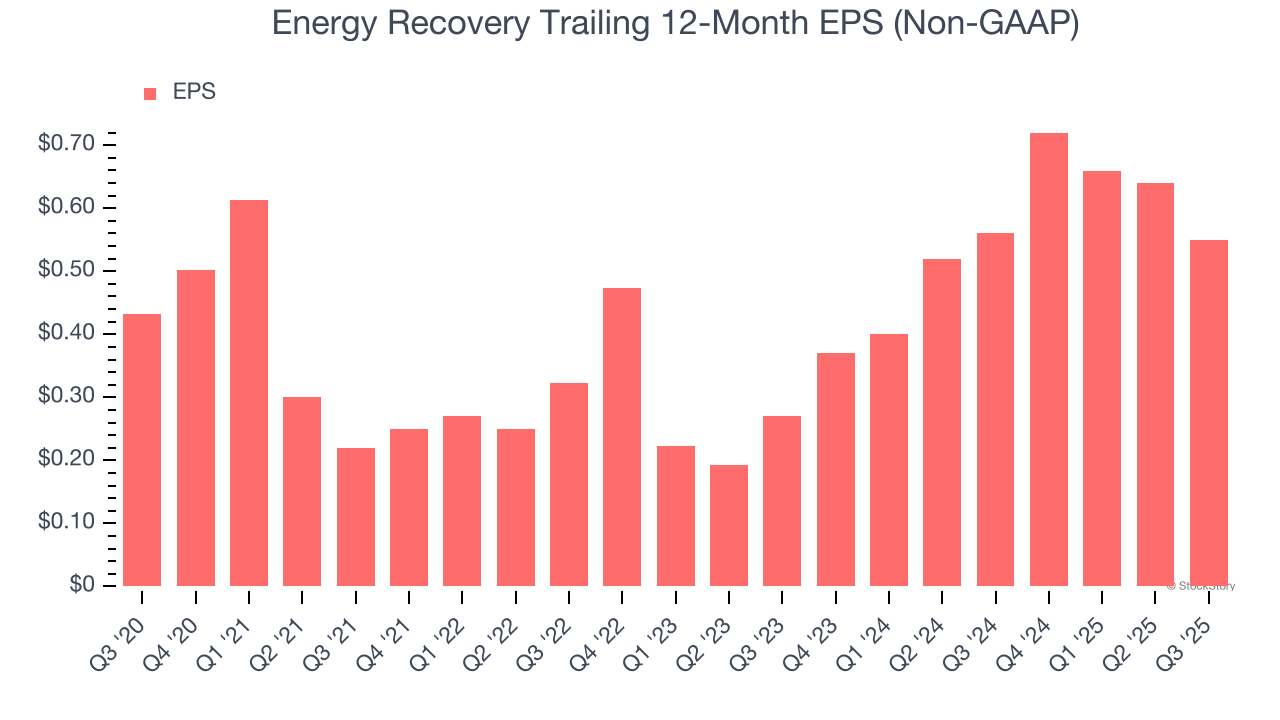
Energy Recovery’s unimpressive 4.9% annual EPS growth over the last five years aligns with its revenue performance. On the bright side, this tells us its incremental sales were profitable.
Like with revenue, we analyze EPS over a more recent period because it can provide insight into an emerging theme or development for the business.
Energy Recovery’s two-year annual EPS growth of 42.6% was fantastic and topped its 9.2% two-year revenue growth.
We can take a deeper look into Energy Recovery’s earnings quality to better understand the drivers of its performance. A two-year view shows that Energy Recovery has repurchased its stock, shrinking its share count by 7.8%. This tells us its EPS outperformed its revenue not because of increased operational efficiency but financial engineering, as buybacks boost per share earnings. 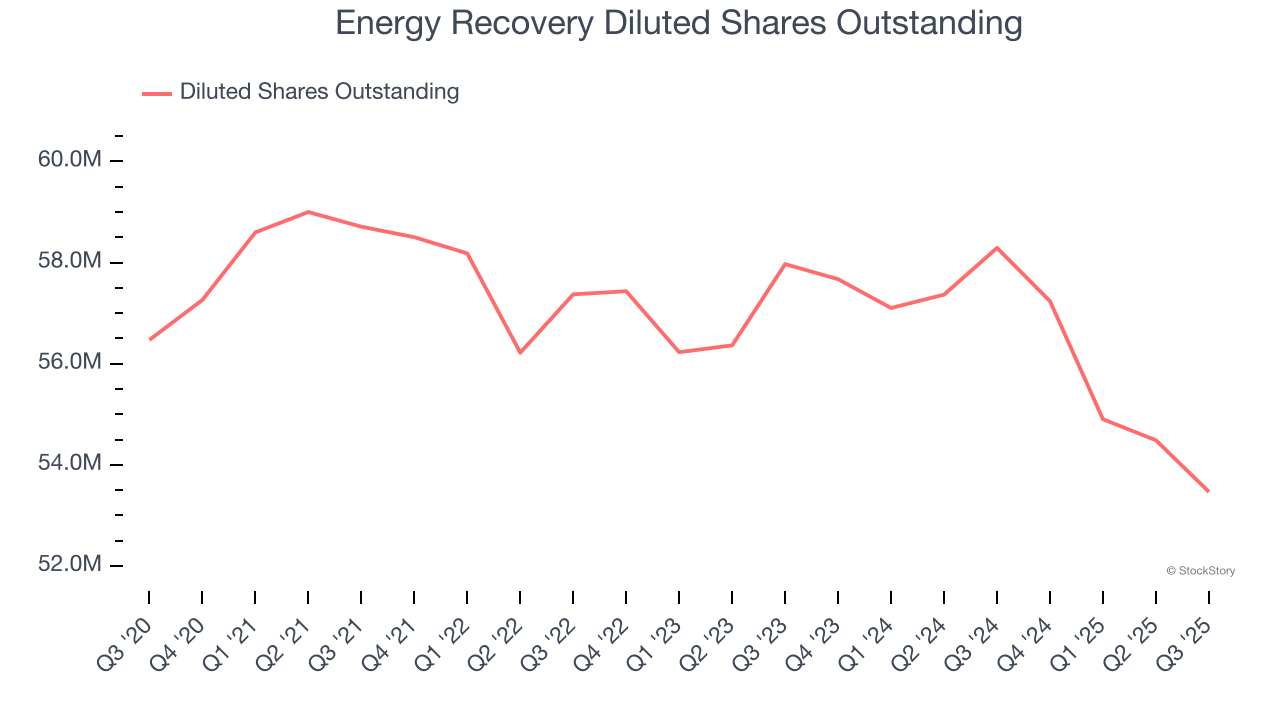
In Q3, Energy Recovery reported adjusted EPS of $0.12, down from $0.21 in the same quarter last year. Despite falling year on year, this print easily cleared analysts’ estimates. Over the next 12 months, Wall Street expects Energy Recovery’s full-year EPS of $0.55 to grow 55.3%.
Key Takeaways from Energy Recovery’s Q3 Results
We were impressed by how significantly Energy Recovery blew past analysts’ revenue expectations this quarter. We were also glad its EPS outperformed Wall Street’s estimates. On the other hand, its EBITDA missed. Overall, we think this was a mixed quarter. Investors were likely hoping for more, and shares traded down 6% to $16.20 immediately following the results.
So do we think Energy Recovery is an attractive buy at the current price? The latest quarter does matter, but not nearly as much as longer-term fundamentals and valuation, when deciding if the stock is a buy. We cover that in our actionable full research report which you can read here, it’s free for active Edge members.