
Government IT services provider Science Applications International Corporation (NASDAQ: SAIC) met Wall Streets revenue expectations in Q3 CY2025, but sales fell by 5.6% year on year to $1.87 billion. The company’s outlook for the full year was close to analysts’ estimates with revenue guided to $7.3 billion at the midpoint. Its non-GAAP profit of $2.58 per share was 20.2% above analysts’ consensus estimates.
Is now the time to buy SAIC? Find out by accessing our full research report, it’s free for active Edge members.
SAIC (SAIC) Q3 CY2025 Highlights:
- Revenue: $1.87 billion vs analyst estimates of $1.87 billion (5.6% year-on-year decline, in line)
- Adjusted EPS: $2.58 vs analyst estimates of $2.15 (20.2% beat)
- Adjusted EBITDA: $185 million vs analyst estimates of $176.2 million (9.9% margin, 5% beat)
- The company slightly lifted its revenue guidance for the full year to $7.3 billion at the midpoint from $7.29 billion
- Management raised its full-year Adjusted EPS guidance to $9.90 at the midpoint, a 4.2% increase
- EBITDA guidance for the full year is $695 million at the midpoint, above analyst estimates of $683.1 million
- Operating Margin: 6.9%, down from 8.1% in the same quarter last year
- Free Cash Flow Margin: 7.2%, up from 0.5% in the same quarter last year
- Backlog: $23.79 billion at quarter end
- Market Capitalization: $4.03 billion
Company Overview
With over five decades of experience supporting national security missions, Science Applications International Corporation (NASDAQ: SAIC) provides technical, engineering, and enterprise IT services primarily to U.S. government agencies and military branches.
Revenue Growth
A company’s long-term sales performance can indicate its overall quality. Any business can experience short-term success, but top-performing ones enjoy sustained growth for years.
With $7.35 billion in revenue over the past 12 months, SAIC is one of the larger companies in the business services industry and benefits from a well-known brand that influences purchasing decisions. However, its scale is a double-edged sword because finding new avenues for growth becomes difficult when you already have a substantial market presence. For SAIC to boost its sales, it likely needs to adjust its prices, launch new offerings, or lean into foreign markets.
As you can see below, SAIC’s 1.3% annualized revenue growth over the last five years was sluggish. This shows it failed to generate demand in any major way and is a rough starting point for our analysis.
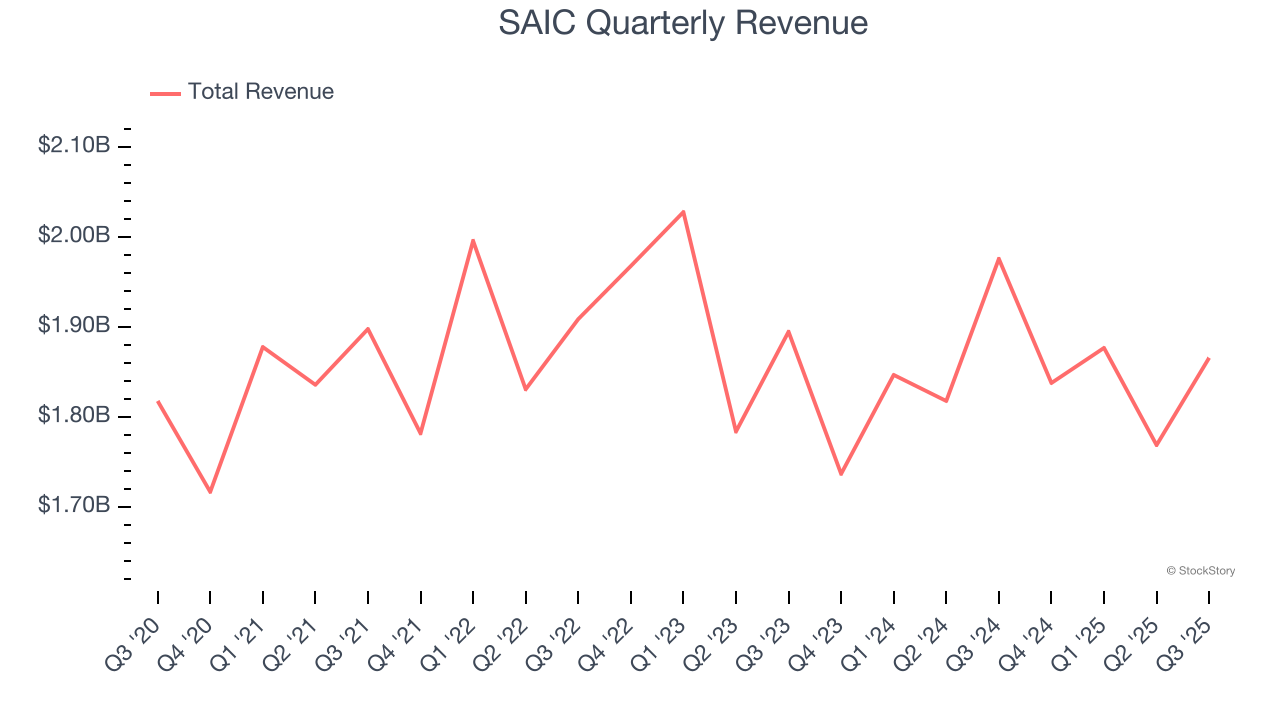
We at StockStory place the most emphasis on long-term growth, but within business services, a half-decade historical view may miss recent innovations or disruptive industry trends. SAIC’s performance shows it grew in the past but relinquished its gains over the last two years, as its revenue fell by 2.1% annually. 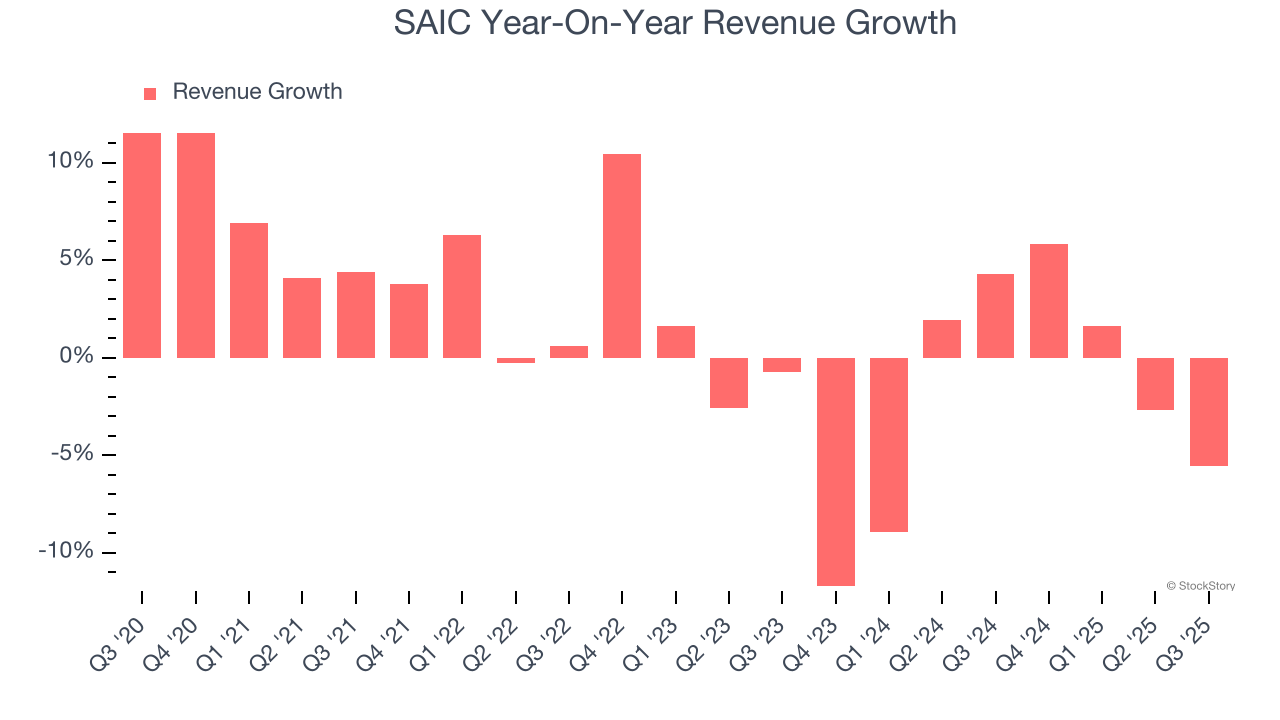
This quarter, SAIC reported a rather uninspiring 5.6% year-on-year revenue decline to $1.87 billion of revenue, in line with Wall Street’s estimates.
Looking ahead, sell-side analysts expect revenue to remain flat over the next 12 months. Although this projection indicates its newer products and services will spur better top-line performance, it is still below the sector average.
Microsoft, Alphabet, Coca-Cola, Monster Beverage—all began as under-the-radar growth stories riding a massive trend. We’ve identified the next one: a profitable AI semiconductor play Wall Street is still overlooking. Go here for access to our full report.
Operating Margin
Operating margin is one of the best measures of profitability because it tells us how much money a company takes home after subtracting all core expenses, like marketing and R&D.
SAIC’s operating margin might fluctuated slightly over the last 12 months but has generally stayed the same, averaging 7.4% over the last five years. This profitability was paltry for a business services business and caused by its suboptimal cost structure.
Looking at the trend in its profitability, SAIC’s operating margin might fluctuated slightly but has generally stayed the same over the last five years. This raises questions about the company’s expense base because its revenue growth should have given it leverage on its fixed costs, resulting in better economies of scale and profitability.
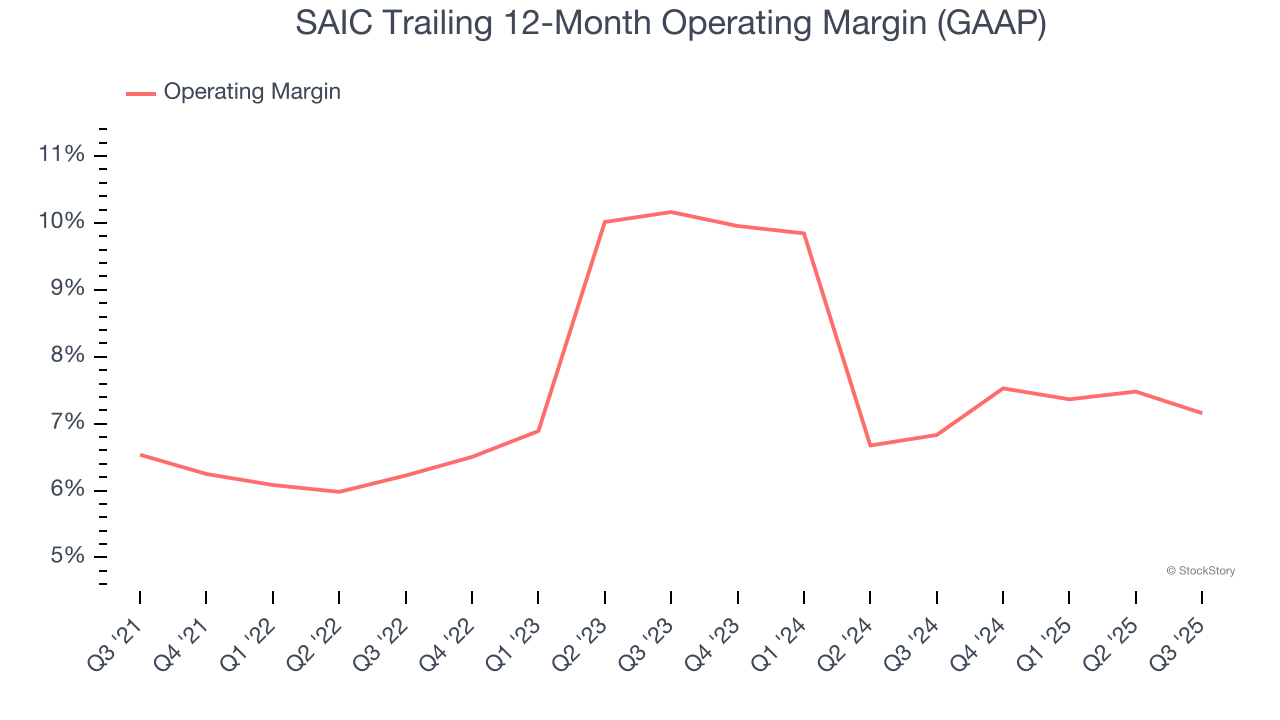
This quarter, SAIC generated an operating margin profit margin of 6.9%, down 1.2 percentage points year on year. This reduction is quite minuscule and indicates the company’s overall cost structure has been relatively stable.
Earnings Per Share
We track the long-term change in earnings per share (EPS) for the same reason as long-term revenue growth. Compared to revenue, however, EPS highlights whether a company’s growth is profitable.
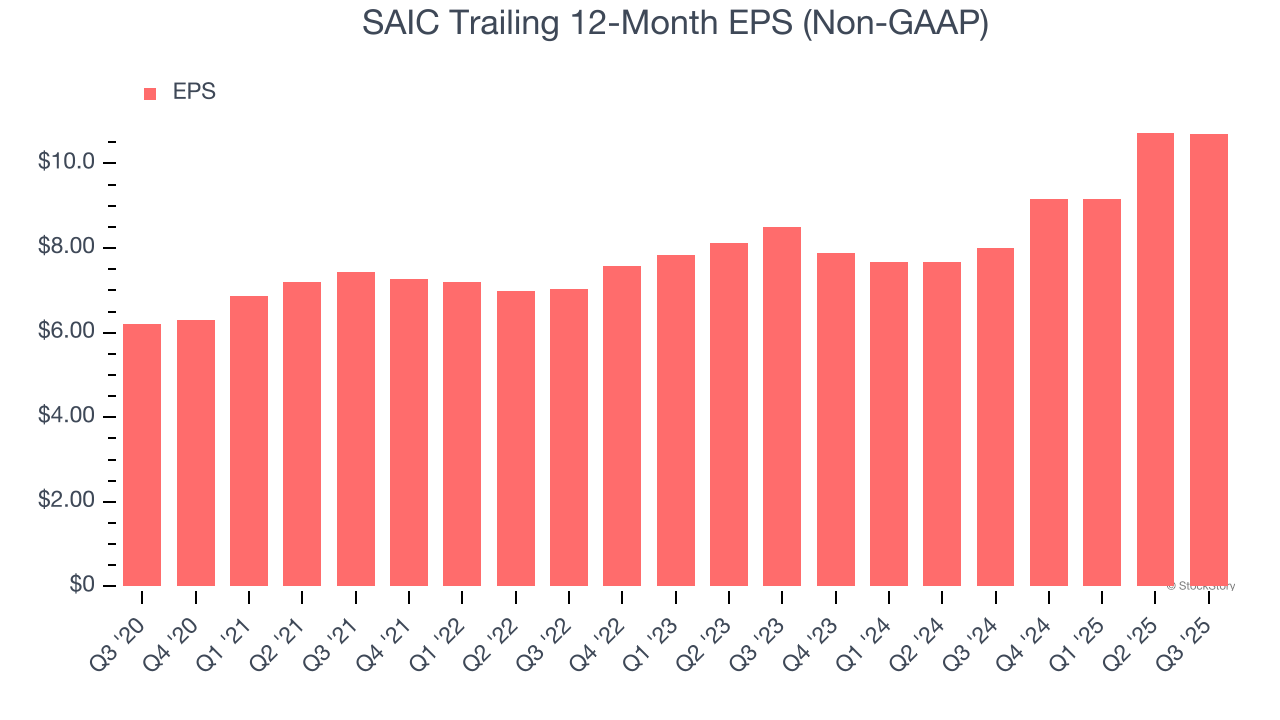
SAIC’s EPS grew at a remarkable 11.5% compounded annual growth rate over the last five years, higher than its 1.3% annualized revenue growth. However, this alone doesn’t tell us much about its business quality because its operating margin didn’t improve.
Like with revenue, we analyze EPS over a more recent period because it can provide insight into an emerging theme or development for the business.
For SAIC, its two-year annual EPS growth of 12.2% is similar to its five-year trend, implying strong and stable earnings power.
In Q3, SAIC reported adjusted EPS of $2.58, down from $2.61 in the same quarter last year. Despite falling year on year, this print easily cleared analysts’ estimates. Over the next 12 months, Wall Street expects SAIC’s full-year EPS of $10.70 to shrink by 17.6%.
Key Takeaways from SAIC’s Q3 Results
It was good to see SAIC beat analysts’ EBITDA and EPS expectations this quarter. We were also glad its full-year EPS guidance outperformed Wall Street’s estimates. Overall, we think this was a decent quarter with some key metrics above expectations. The stock traded up 4.8% to $91.75 immediately following the results.
SAIC had an encouraging quarter, but one earnings result doesn’t necessarily make the stock a buy. Let’s see if this is a good investment. What happened in the latest quarter matters, but not as much as longer-term business quality and valuation, when deciding whether to invest in this stock. We cover that in our actionable full research report which you can read here, it’s free for active Edge members.