Academic publishing company John Wiley & Sons (NYSE: WLY) beat Wall Street’s revenue expectations in Q3 CY2025, but sales fell by 1.1% year on year to $421.8 million. Its non-GAAP profit of $1.10 per share was 13.4% above analysts’ consensus estimates.
Is now the time to buy Wiley? Find out by accessing our full research report, it’s free for active Edge members.
Wiley (WLY) Q3 CY2025 Highlights:
- Revenue: $421.8 million vs analyst estimates of $416.4 million (1.1% year-on-year decline, 1.3% beat)
- Adjusted EPS: $1.10 vs analyst estimates of $0.97 (13.4% beat)
- Adjusted EBITDA: $115.1 million vs analyst estimates of $105 million (27.3% margin, 9.6% beat)
- Management reiterated its full-year Adjusted EPS guidance of $4.13 at the midpoint
- Operating Margin: 17.3%, up from 15.4% in the same quarter last year
- Free Cash Flow was -$8.03 million compared to -$19.81 million in the same quarter last year
- Market Capitalization: $2.01 billion
“We continue to deliver strong performance in Research and accelerating momentum in AI as we capitalize on record research volume and expanding corporate R&D opportunities,” said Matthew Kissner, President and CEO.
Company Overview
With roots dating back to 1807 when Charles Wiley opened a small printing shop in Manhattan, John Wiley & Sons (NYSE: WLY) is a global academic publisher that provides scientific journals, books, digital courseware, and knowledge solutions for researchers, students, and professionals.
Revenue Growth
A company’s long-term sales performance can indicate its overall quality. Any business can experience short-term success, but top-performing ones enjoy sustained growth for years.
With $1.67 billion in revenue over the past 12 months, Wiley is a mid-sized business services company, which sometimes brings disadvantages compared to larger competitors benefiting from better economies of scale.
As you can see below, Wiley struggled to generate demand over the last five years. Its sales dropped by 2.2% annually, a tough starting point for our analysis.
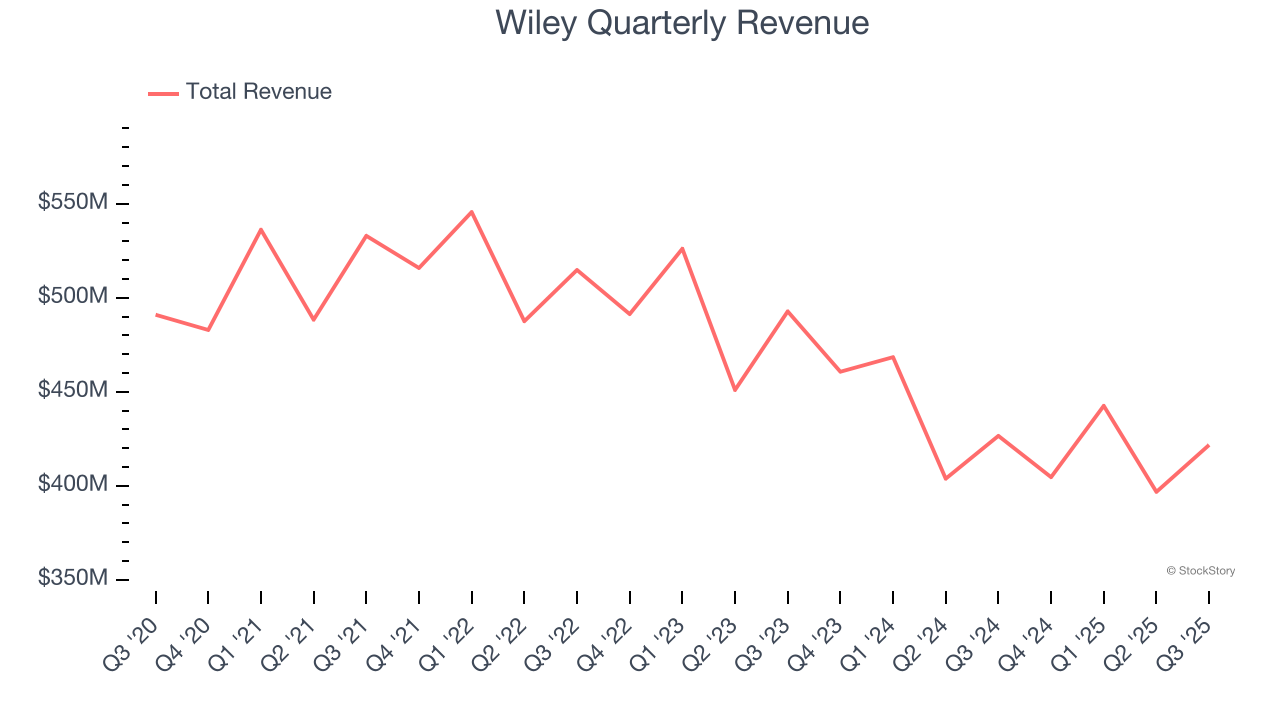
We at StockStory place the most emphasis on long-term growth, but within business services, a half-decade historical view may miss recent innovations or disruptive industry trends. Wiley’s recent performance shows its demand remained suppressed as its revenue has declined by 7.8% annually over the last two years. 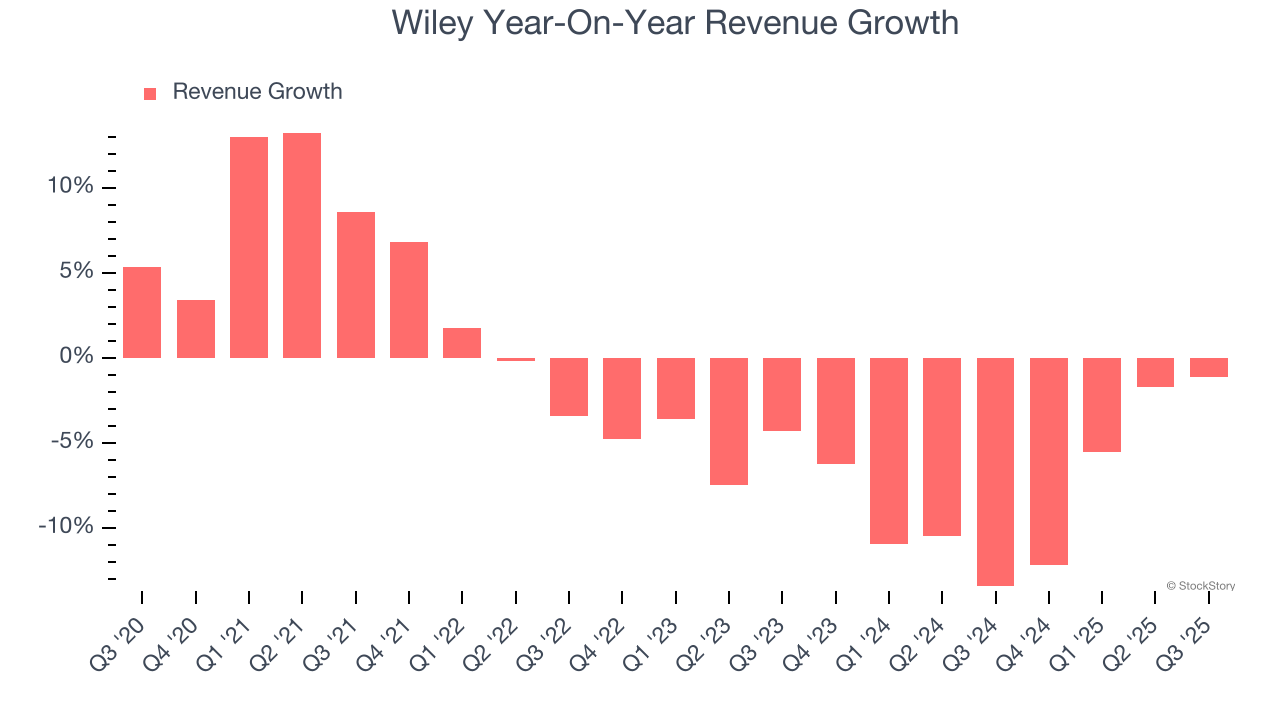
This quarter, Wiley’s revenue fell by 1.1% year on year to $421.8 million but beat Wall Street’s estimates by 1.3%.
Looking ahead, sell-side analysts expect revenue to grow 1.7% over the next 12 months. Although this projection indicates its newer products and services will spur better top-line performance, it is still below the sector average.
The 1999 book Gorilla Game predicted Microsoft and Apple would dominate tech before it happened. Its thesis? Identify the platform winners early. Today, enterprise software companies embedding generative AI are becoming the new gorillas. a profitable, fast-growing enterprise software stock that is already riding the automation wave and looking to catch the generative AI next.
Operating Margin
Operating margin is a key measure of profitability. Think of it as net income - the bottom line - excluding the impact of taxes and interest on debt, which are less connected to business fundamentals.
Wiley has done a decent job managing its cost base over the last five years. The company has produced an average operating margin of 11.9%, higher than the broader business services sector.
Looking at the trend in its profitability, Wiley’s operating margin rose by 2.9 percentage points over the last five years, showing its efficiency has improved.
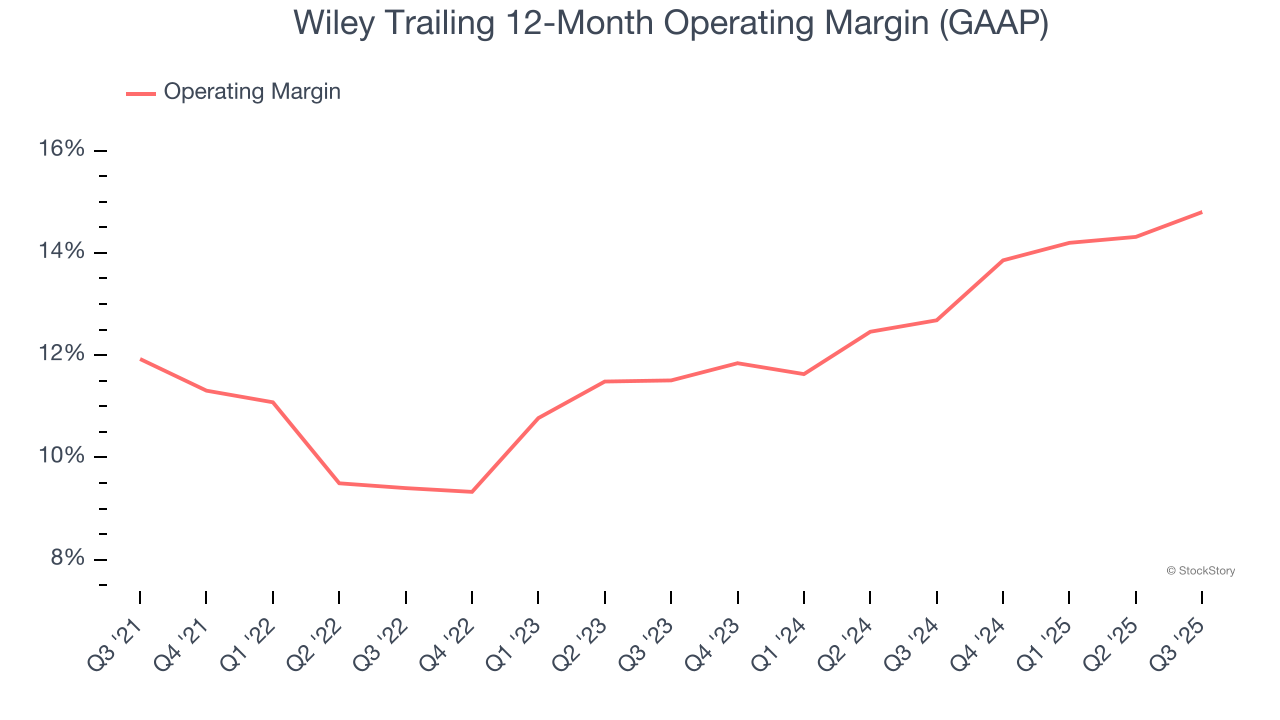
In Q3, Wiley generated an operating margin profit margin of 17.3%, up 1.9 percentage points year on year. This increase was a welcome development, especially since its revenue fell, showing it was more efficient because it scaled down its expenses.
Earnings Per Share
We track the long-term change in earnings per share (EPS) for the same reason as long-term revenue growth. Compared to revenue, however, EPS highlights whether a company’s growth is profitable.
Wiley’s EPS grew at an unimpressive 6.6% compounded annual growth rate over the last five years. On the bright side, this performance was better than its 2.2% annualized revenue declines and tells us management adapted its cost structure in response to a challenging demand environment.
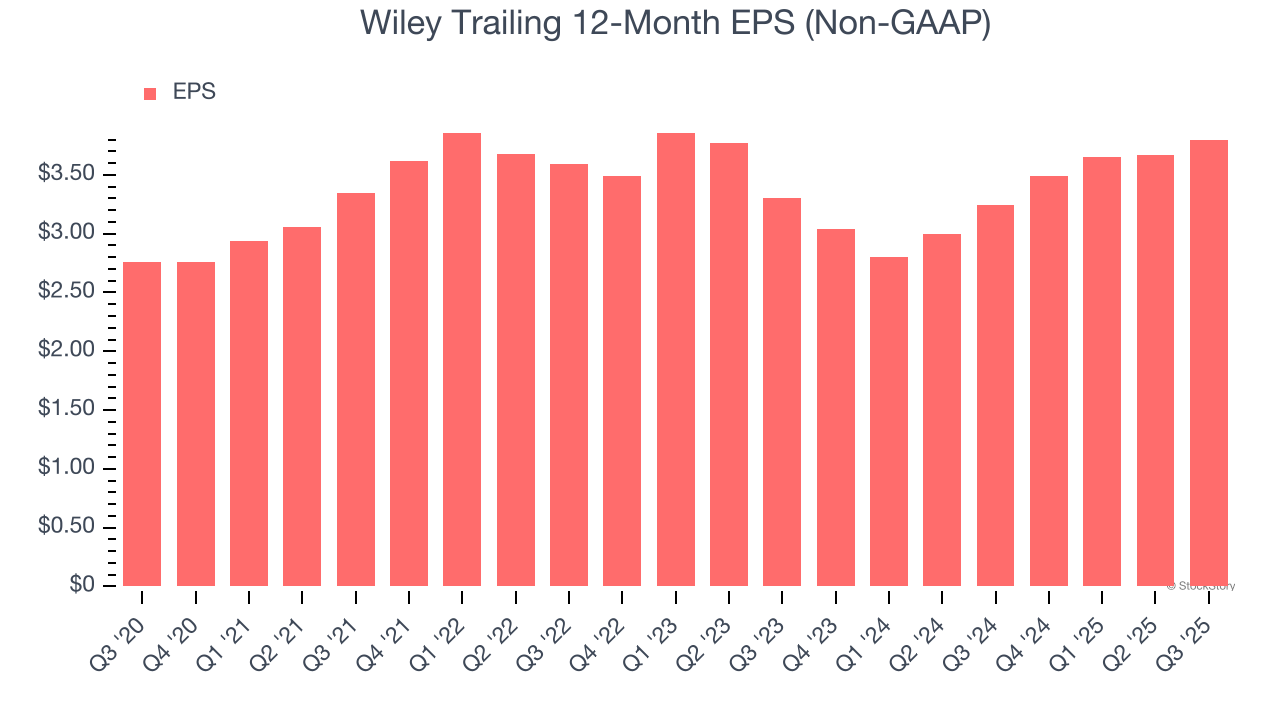
We can take a deeper look into Wiley’s earnings to better understand the drivers of its performance. As we mentioned earlier, Wiley’s operating margin expanded by 2.9 percentage points over the last five years. On top of that, its share count shrank by 4.7%. These are positive signs for shareholders because improving profitability and share buybacks turbocharge EPS growth relative to revenue growth. 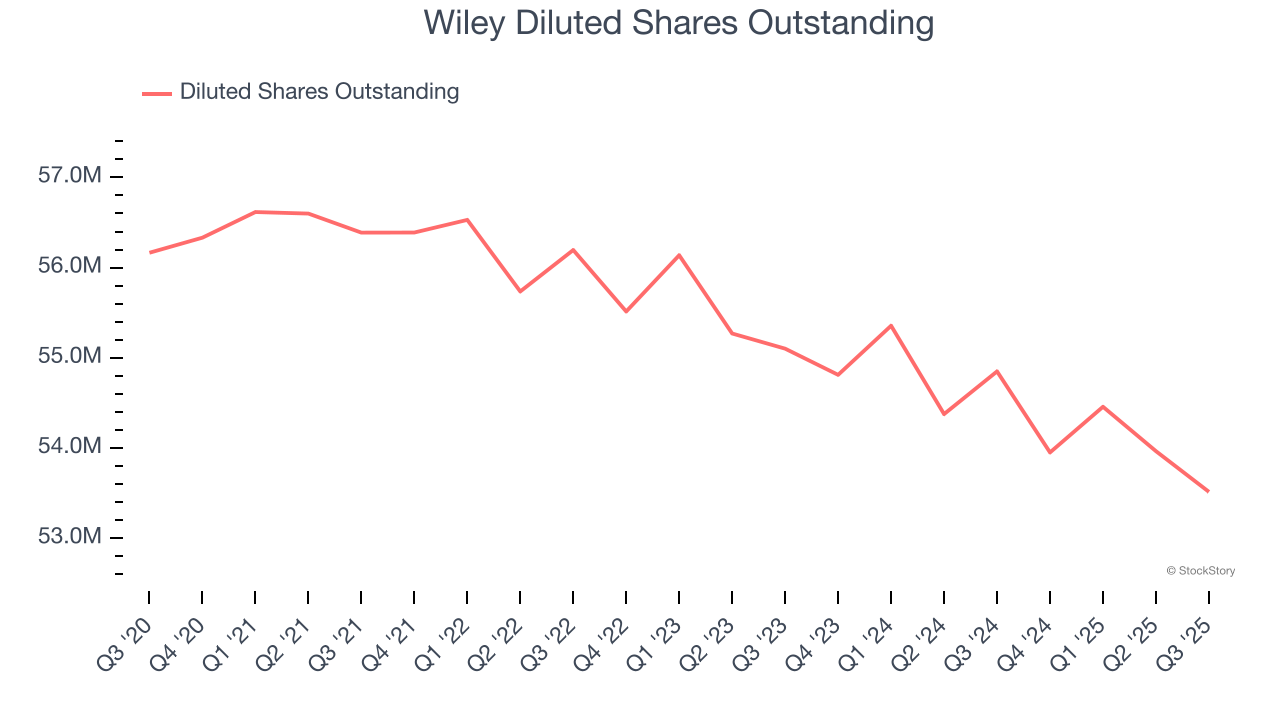
Like with revenue, we analyze EPS over a more recent period because it can provide insight into an emerging theme or development for the business.
For Wiley, its two-year annual EPS growth of 7.3% is similar to its five-year trend, implying stable earnings.
In Q3, Wiley reported adjusted EPS of $1.10, up from $0.97 in the same quarter last year. This print easily cleared analysts’ estimates, and shareholders should be content with the results. We also like to analyze expected EPS growth based on Wall Street analysts’ consensus projections, but there is insufficient data.
Key Takeaways from Wiley’s Q3 Results
It was good to see Wiley beat analysts’ EPS expectations this quarter. We were also glad its full-year EPS guidance outperformed Wall Street’s estimates. Zooming out, we think this quarter featured some important positives. The stock remained flat at $37.89 immediately after reporting.
Should you buy the stock or not? What happened in the latest quarter matters, but not as much as longer-term business quality and valuation, when deciding whether to invest in this stock. We cover that in our actionable full research report which you can read here, it’s free for active Edge members.