
IT solutions provider ePlus (NASDAQ: PLUS) reported Q2 CY2026 results exceeding the market’s revenue expectations, with sales up 1.9% year on year to $649.1 million. Its non-GAAP profit of $1.28 per share was 11.8% above analysts’ consensus estimates.
Is now the time to buy ePlus? Find out by accessing our full research report, it’s free.
ePlus (PLUS) Q2 CY2026 Highlights:
- Revenue: $649.1 million vs analyst estimates of $640 million (1.9% year-on-year growth, 1.4% beat)
- Adjusted EPS: $1.28 vs analyst estimates of $1.15 (11.8% beat)
- Adjusted EBITDA: $46.52 million vs analyst estimates of $45.95 million (7.2% margin, 1.2% beat)
- Operating Margin: 6%, in line with the same quarter last year
- Market Capitalization: $2.42 billion
"The first quarter reflected strong execution against a challenging year over year comparison. We had record sales and saw a significant increase in booked and open orders which we believe positions us for a strong second half. During the quarter, we saw product shipment delays and lead times extended by the ongoing memory chip shortage." commented Mark Marron, President and CEO of ePlus.
Company Overview
Starting as a financing company in 1990 before evolving into a full-service technology provider, ePlus (NASDAQ: PLUS) provides comprehensive IT solutions, professional services, and financing options to help organizations optimize their technology infrastructure and supply chain processes.
Revenue Growth
A company’s long-term performance is an indicator of its overall quality. Any business can put up a good quarter or two, but many enduring ones grow for years.
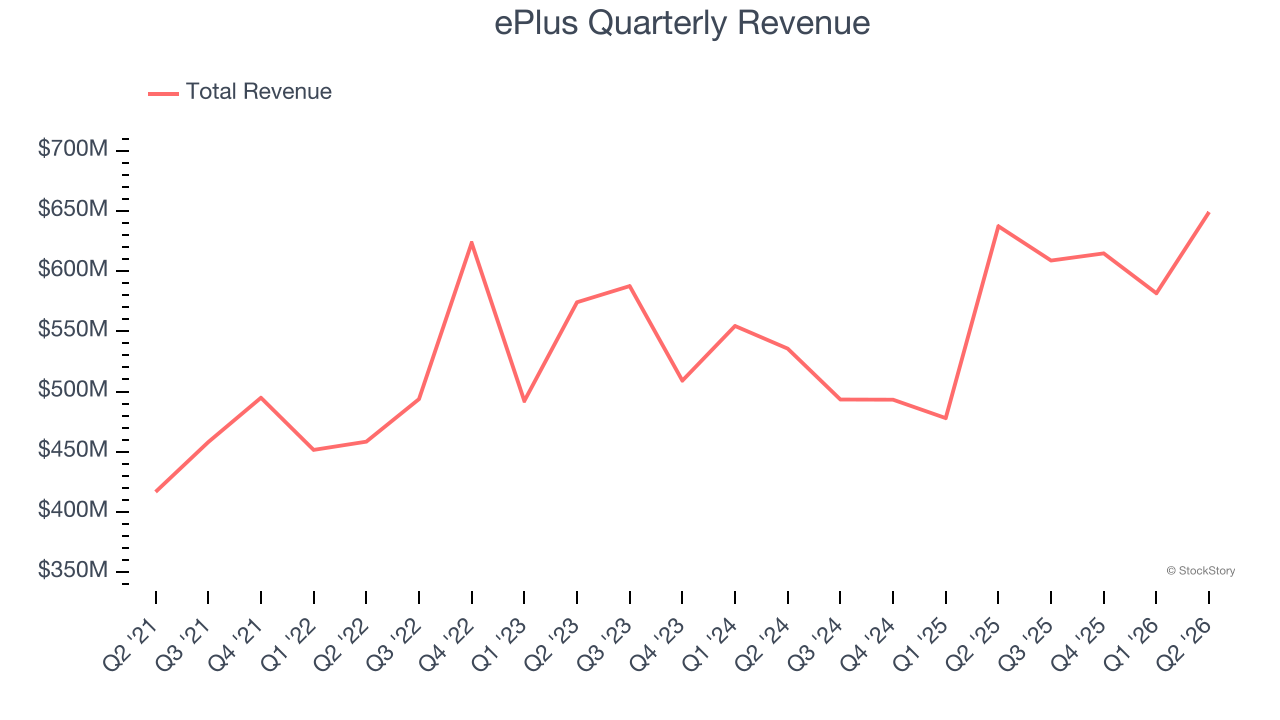
With $2.45 billion in revenue over the past 12 months, ePlus is a mid-sized business services company, which sometimes brings disadvantages compared to larger competitors benefiting from better economies of scale. On the bright side, it can still flex high growth rates because it’s working from a smaller revenue base.
As you can see below, ePlus grew its sales at a solid 8.5% compounded annual growth rate over the last five years. This shows it had high demand, a useful starting point for our analysis.
Long-term growth is the most important, but within business services, a half-decade historical view may miss new innovations or demand cycles. ePlus’s annualized revenue growth of 5.9% over the last two years is below its five-year trend, but we still think the results were respectable. 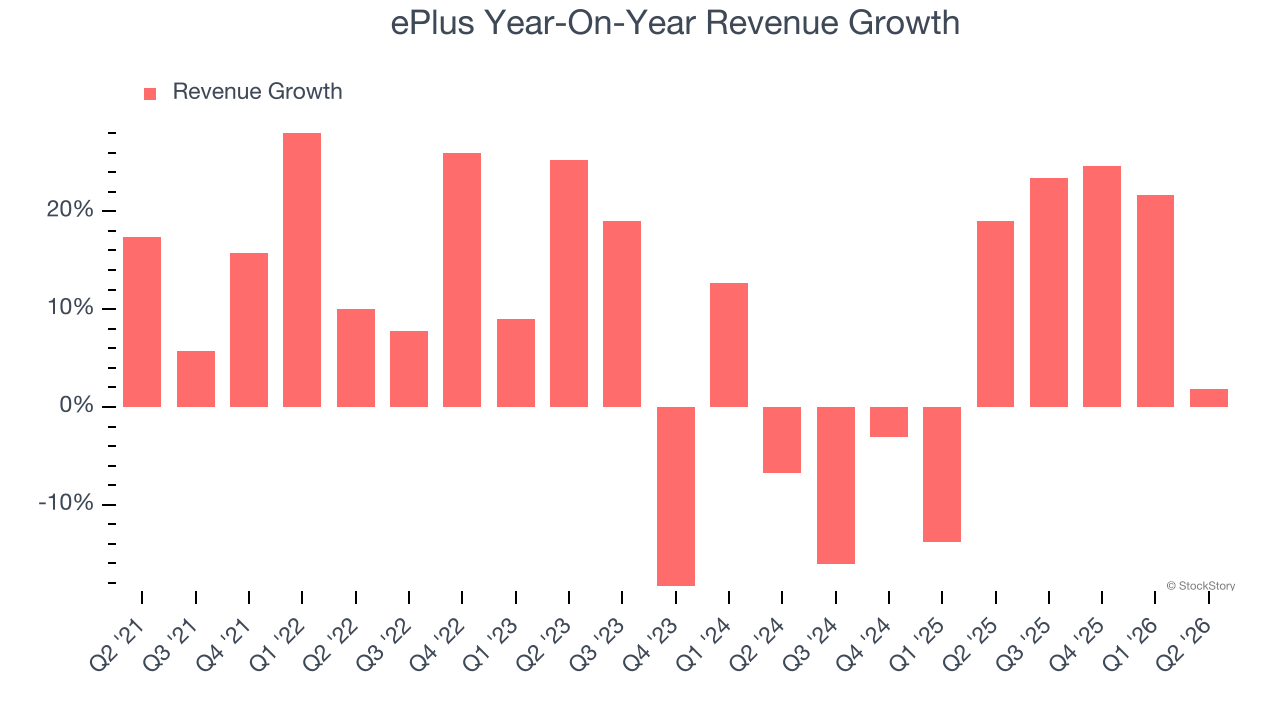
This quarter, ePlus reported modest year-on-year revenue growth of 1.9% but beat Wall Street’s estimates by 1.4%.
Looking ahead, sell-side analysts expect revenue to grow 5.9% over the next 12 months, similar to its two-year rate. This projection is above the sector average and indicates its newer products and services will help sustain its recent top-line performance.
ALSO WORTH WATCHING: Nvidia’s Quiet Partner. Nvidia’s chips cost a hundred grand. The connectors that make them work cost even more. One company makes them all.
Every AI server needs specialized infrastructure the chip companies don’t make. High-speed cables. Power connectors. Thermal sensors. This 90-year-old company built a monopoly on it. The AI boom just started. This stock is still flying under the radar. Claim The Stock Ticker Here for FREE.
Adjusted Operating Margin
ePlus was profitable over the last five years but held back by its large cost base. Its average adjusted operating margin of 7.5% was weak for a business services business.
Looking at the trend in its profitability, ePlus’s adjusted operating margin decreased by 1.1 percentage points over the last five years. This raises questions about the company’s expense base because its revenue growth should have given it leverage on its fixed costs, resulting in better economies of scale and profitability. ePlus’s performance was poor no matter how you look at it - it shows that costs were rising and it couldn’t pass them onto its customers.
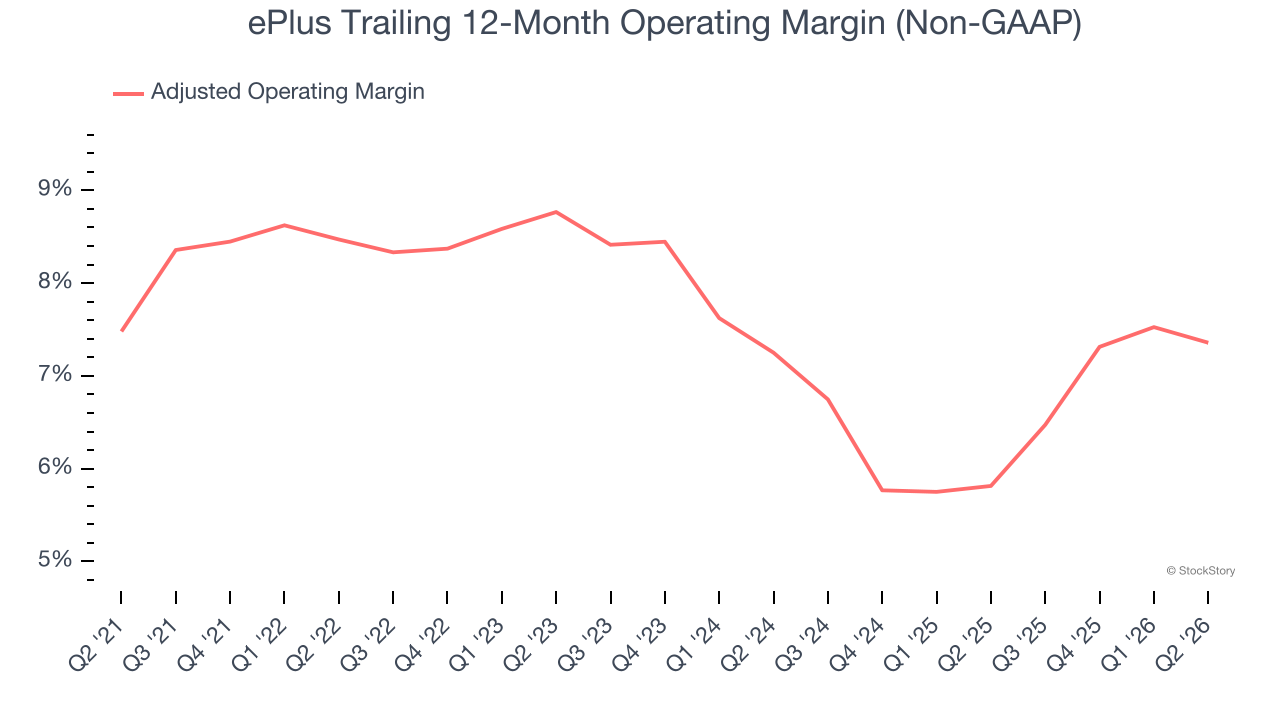
In Q2, ePlus generated an adjusted operating margin profit margin of 6.5%, in line with the same quarter last year. This indicates the company’s overall cost structure has been relatively stable.
Earnings Per Share
Revenue trends explain a company’s historical growth, but the long-term change in earnings per share (EPS) points to the profitability of that growth — for example, a company could inflate its sales through excessive spending on advertising and promotions.
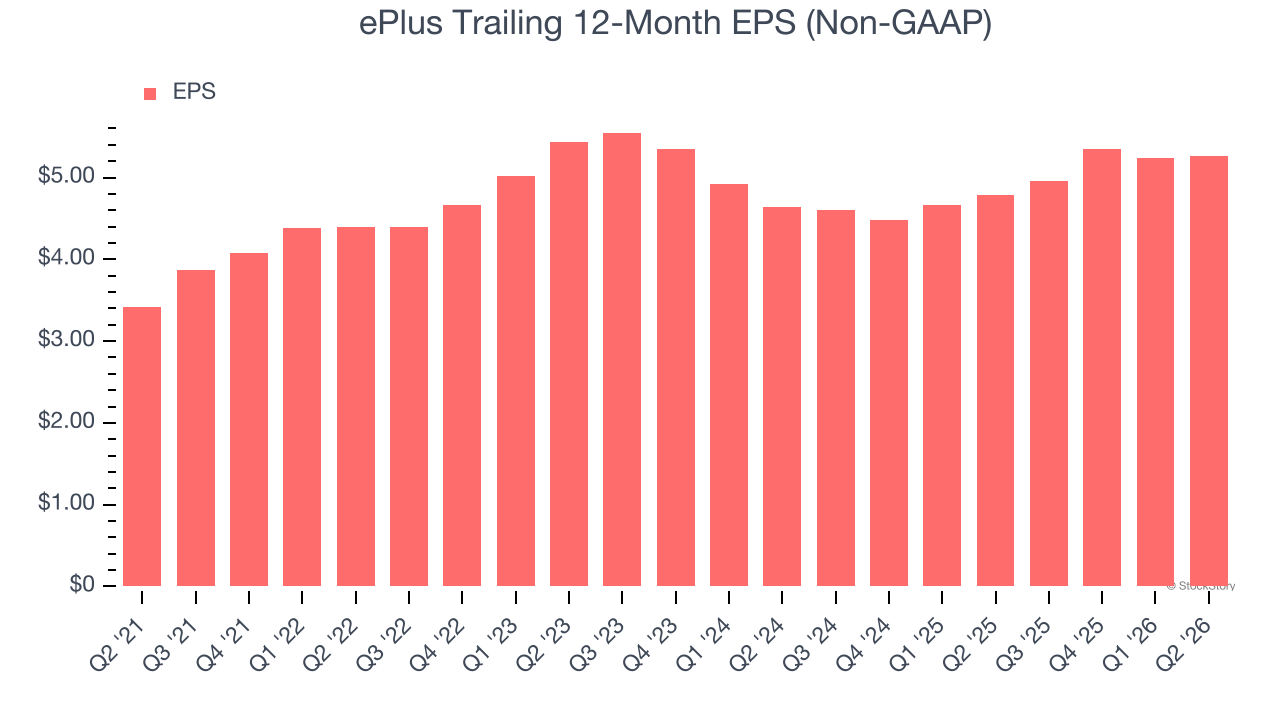
ePlus’s decent 9% annual EPS growth over the last five years aligns with its revenue performance. This tells us it maintained its per-share profitability as it expanded.
Like with revenue, we analyze EPS over a more recent period because it can provide insight into an emerging theme or development for the business.
For ePlus, its two-year annual EPS growth of 6.5% was lower than its five-year trend. We hope its growth can accelerate in the future.
In Q2, ePlus reported adjusted EPS of $1.28, up from $1.26 in the same quarter last year. This print easily cleared analysts’ estimates, and shareholders should be content with the results. Over the next 12 months, Wall Street expects ePlus’s full-year EPS to grow 2% from $5.26 to $5.36.
Key Takeaways from ePlus’s Q2 Results
It was good to see ePlus beat analysts’ EPS expectations this quarter. We were also happy its revenue narrowly outperformed Wall Street’s estimates. Zooming out, we think this quarter featured some important positives. The stock remained flat at $96.53 immediately following the results.
Should you buy the stock or not? We think that the latest quarter is only one piece of the longer-term business quality puzzle. Quality, when combined with valuation, can help determine if the stock is a buy. We cover that in our actionable full research report which you can read here (it’s free).