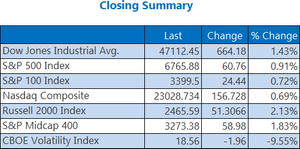
Market Indicators
World Markets
More


Sector ETFs
More Sectors| Sector | % Change | YTD % |
|---|---|---|
| Basic Materials | +1.40% |
+13.87% |
| Consumer Goods | +1.31% |
+5.53% |
| Energy | -0.55% |
+2.21% |
| Financial Services | +1.33% |
+13.47% |
| Healthcare | +2.23% |
+14.60% |
| Industrial | +1.66% |
+8.58% |
| Technology | +0.29% |
+22.53% |
| Telecom | +0.56% |
+19.73% |
| Utilities | -0.22% |
+16.00% |
Market News
View More
Why Novartis Stock Topped the Market Today ↗
Today 19:17 EST
NetApp (NTAP) Q2 2026 Earnings Call Transcript ↗
Today 18:47 EST

Warner Bros. Sale Rumors Heat Up: What Investors Need to Know ↗
Today 18:23 EST
Autodesk (ADSK) Q3 2026 Earnings Call Transcript ↗
Today 18:20 EST

An Extended Market ↗
Today 18:50 EST
Currencies
More Currencies


More News
View More


Why Symbotic Stock Skyrocketed Today ↗
Today 17:05 EST

P/E Ratio Insights for IDEXX Laboratories ↗
Today 17:00 EST


From Science Project to Solvent: WeRide’s 761% Revenue Surge ↗
Today 17:48 EST


Stock Quote API & Stock News API supplied by www.cloudquote.io
Quotes delayed at least 20 minutes.
By accessing this page, you agree to the Privacy Policy and Terms Of Service.
Quotes delayed at least 20 minutes.
By accessing this page, you agree to the Privacy Policy and Terms Of Service.
© 2025 FinancialContent. All rights reserved.