
News Source: Optimal Blue
Optimal Blue data shows modest lock volume growth as purchase activity levels off and investor demand for shorter-duration assets grows
PLANO, Texas, July 8, 2025 (SEND2PRESS NEWSWIRE) — Optimal Blue today released its June 2025 Market Advantage mortgage data report showing total lock volume rose 1.95% month-over-month (MoM), driven by increased refinance activity. Refinance share climbed from 16% to 18% of all locks as rate-and-term refinances jumped 17.4% MoM and 18.4% year-over-year (YoY). Cash-out refinances rose 8.1% from May and nearly 28% YoY. Meanwhile, purchase activity held relatively steady – a better-than-expected result for June, when the spring homebuying season typically tapers off.
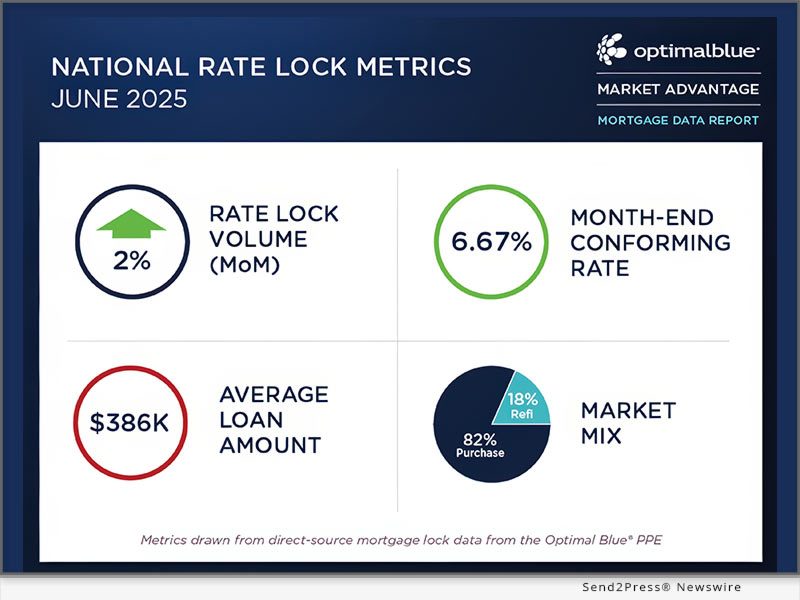
Image caption: Image caption: Optimal Blue’s June 2025 Market Advantage mortgage data report.
The report includes 19 mortgage data metrics, including additional borrower profile metrics and secondary market indicators newly introduced last month. One of these new metrics, non-QM lending, accounted for 7.4% of all June rate locks – a share that has gradually increased in recent months as lenders and borrowers explore alternative qualification paths.
“As market conditions evolve and affordability challenges persist, non-QM lending offers a path for qualifying creditworthy borrowers who may not meet qualified mortgage guidelines,” said Mike Vough, head of corporate strategy at Optimal Blue. “The steady rise in this category reflects the industry’s growing focus on flexibility and meeting borrowers where they are.”
On the capital markets side, the aggregator share of loan sales dropped 300 basis points (bps) MoM to 35%, suggesting that the agencies improved pricing margins and gained market share, either via the cash window or MBS securitizations.
“Given current news headlines, the decrease in aggregator market share corresponding with the increase in agency market share is noteworthy,” said Vough. “Both loans sold to the cash window and via MBS securitization were up 2% month over month. This highlights the need for lenders to review multiple investors and delivery methods to squeeze the most out of their loan sales.”
Key findings from the Market Advantage report, derived from direct-source mortgage lock and secondary market data, include:
- Rates edge lower: The 30-year conforming loan rate dropped 17 bps to 6.67%. Jumbo rates fell 24 bps to 6.78%. FHA rates declined 6 bps to 6.47%, and VA rates decreased 16 bps to 6.29%.
- Product mix shifts: Conforming share rose 114 bps to 53% of total volume, while non-conforming dipped 25 bps to 16.2%. FHA share declined 80 bps to 18.9%. VA and USDA shares held steady at or near last month’s levels at 11.3% and 0.7%, respectively.
- Credit quality unchanged: The average FICO score edged up 1 point to 733.
- Loan characteristics hold steady: The average loan amount declined slightly to $386,084. Across the top 30 MSAs, average loan amounts ranged from a high of $586,997 in metro New York to a low of $311,331 in Indianapolis. Average loan-to-value (LTV) ratio stood at 80.5%. Debt-to-income (DTI) ratio averaged 36.8% for conforming loans, 44.7% for FHA and 43.8% for VA.
- ARMs decline: Adjustable-rate mortgage (ARM) share fell to 8.81%, compared to 9.11% in May. This decrease coincided with a slight flattening of the yield curve compared to the previous month.
- Market spread trends remain steady: The 10-year Treasury yield dropped 17 bps to 4.24%, while the OBMMI 30-year conforming fixed rate (the benchmark for CME Group’s Mortgage Rate futures) declined 17 bps to 6.67%, keeping the spread steady at 2.43%.
- Loan sales trend in agencies’ favor: Bulk aggregator sales declined 300 bps to 35%, while agency share grew as cash and MBS executions each rose 200 bps, signaling stronger agency appetite.
- Loan pricing improves: The share of loans sold at the highest price increased 100 bps to 69%, while sales in the lowest pricing tier declined 100 bps to 12%, suggesting that loan characteristics or eligibility requirements played a smaller role in driving price dispersion.
- Servicing valuations edge lower: MSR values for 30-year conforming loans declined slightly to 1.226%, tracking alongside the decrease in mortgage rates.
- Pull-through rates increase: Supported by late-month rate improvements and steady new construction activity, purchase pull-through rose 170 bps to 84.8% and refinance pull-through climbed 29 bps to 62.6%.
To view the full June 2025 Market Advantage report, complete the free subscription form: https://engage.optimalblue.com/market-advantage.
Subscribers receive a report PDF each month with the latest data. Members of the press are eligible for special, advance access each month and should contact Olivia DeLancey to be added to the media list.
This month’s Market Advantage podcast features Rob Kessel, founder of Panoramic Capital Advisory and Consulting. Access the podcast: https://market-advantage.captivate.fm/episode/episode-10.
About the Market Advantage Report
Optimal Blue issues the Market Advantage mortgage report each month to provide insight into U.S. mortgage trends and drivers of lending profitability. Data is sourced from the Optimal Blue PPE, which is used to price and lock more than one-third of all mortgages nationwide, and Optimal Blue’s hedging and loan trading system, which supports approximately 40% of loans hedged and sold into the secondary market. As the leader in mortgage capital markets technology, Optimal Blue has a direct view of both origination and secondary market activity, and the interconnectedness of the two. Unlike self-reported survey data, Optimal Blue’s direct-source data accurately reflects the in-process loans in lenders’ pipelines and secondary market executions. Visit Optimal Blue’s website to subscribe to receive the free report each month.
Nothing herein shall be construed as, nor is Optimal Blue providing, any legal, trading, hedging, or financial advice.
About Optimal Blue
Optimal Blue effectively bridges the primary and secondary mortgage markets to deliver the industry’s only end-to-end capital markets platform. The company helps lenders of all sizes and scopes maximize profitability and operate efficiently so they can help American borrowers achieve the dream of homeownership. Through innovative technology, a network of interconnectivity, rich data insights, and expertise gathered over more than 20 years, Optimal Blue is an experienced partner that, in any market environment, allows lenders to optimize their advantage from pricing accuracy to margin protection, and every step in between. To learn more, visit https://OptimalBlue.com/.
MULTIMEDIA:
Image link for media: https://www.Send2Press.com/300dpi/25-0708-s2popblujune-300dpi.jpg
Image caption: Optimal Blue’s June 2025 Market Advantage mortgage data report.
This press release was issued on behalf of the news source (Optimal Blue), who is solely responsible for its accuracy, by Send2Press Newswire.
To view the original story, visit: https://www.send2press.com/wire/refis-product-shifts-and-strong-agency-participation-define-june-market-advantage-report/
Copr. © 2025 Send2Press® Newswire, Calif., USA. -- REF: S2P STORY ID: S2P127507 FCN24-3B
INFORMATION BELOW THIS PAGE, IF ANY, IS UNRELATED TO THIS PRESS RELEASE.


