For speculators intrigued by discounts among blue-chip giants, healthcare juggernaut AbbVie (ABBV) is well worth consideration. Recently, ABBV stock triggered an unusual quantitative signal. In the past 10 weeks, only three of the weekly candlesticks were bullish (defined as the negative return between Monday’s open and Friday’s close).
Such signals are quite rare for ABBV stock, which features an upward bias. However, they also make for compelling opportunities for contrarians. Since January 2019, this quant pattern has only materialized less than 8% of the time on a rolling basis relative to all other 10-week sequences. However, more often than not, a recovery occurs over the course of the next 10 weeks.
Adding to the enthusiasm for AbbVie stock is unusual activity in the options market, specifically in the options flow screener. A readout that focuses exclusively on big block transactions, options flow showed that net trade sentiment on Friday was $443,400 above parity, thus favoring the bulls. In fact, the whole week saw positive flows, with the minor exception of Wednesday, where flow was negative by only $18,200.
Interestingly, options flow was decidedly pessimistic for the business week beginning Dec. 1. In contrast, that week was entirely negative except for the midweek session, which saw net trade sentiment stand at a very modest $28,400.
To be fair, you always need to exercise caution when looking into any metric. However, from the data at hand, it does seem that the smart money believes something may be brewing for ABBV stock. That something could very well be reflexivity.
A concept popularized by George Soros, reflexivity loosely refers to investor perceptions — reinforced through feedback loops — altering reality. With AbbVie stock down roughly 9% since the first of October, contrarians are likely to view the security as a discounted play.
While we can’t know the true source of reflexivity, we can measure the likelihood of it sprouting — and the potential magnitude of its influence when it does.
Navigating the Risk Geometry of ABBV Stock
Although we currently have evidence that ABBV stock could be poised for an upside move, we need to have some idea of where it may end up if we are to exploit the potential bullishness. For that, we may refer to Barchart’s Expected Move calculator. By integrating implied volatility (IV) data and reverse engineering a proprietary Black-Scholes-based formulation, we note that the range of outcomes for the Feb. 20, 2026 expiration date lands between $205.45 and $241.19.
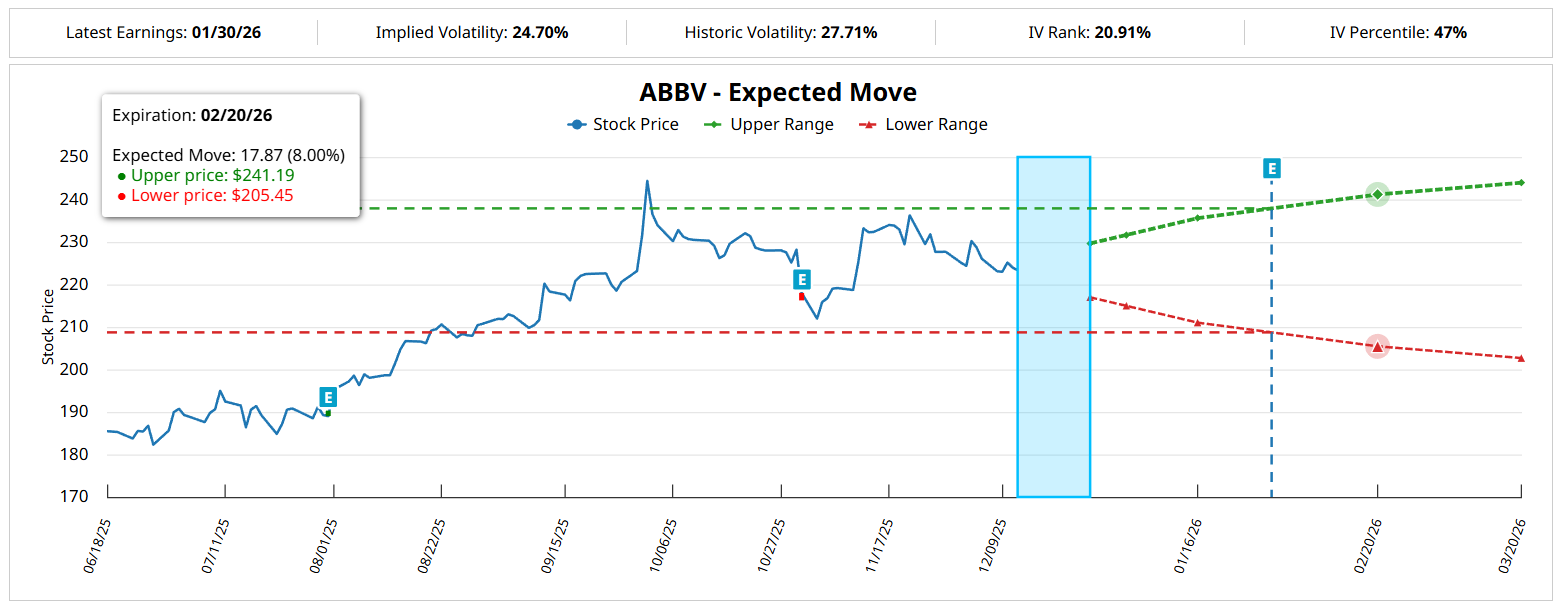
Now, we don’t quite know where ABBV stock is going to land precisely. However, we can see that, if we were to be optimistically contrarian, debit call spreads with strike prices near $241 will likely pay out more, all other things being equal. In other words, the heavyweights in the options market are more likely to be sellers near $241 than buyers.
As such, you should be able to buy relatively cheap spreads here. However, you must also calculate whether it makes sense to be a buyer or not. That’s where distributional analysis comes in.
Earlier, I mentioned that ABBV stock printed a rare quant signal, which can be abbreviated as 3-7-D: three up weeks, seven down weeks, with an overall downward slope. By discretizing and iterating historical price data, we can look up past instances of the 3-7-D sequence. From there, we can calculate forward probabilities adjusted for the current market environment.
Using Friday’s closing price of $223.32 as an anchor, the aforementioned sequence may lead to ABBV stock ranging between $208 to $261 over the next 10 weeks. Further, probability density would be most elevated between $230 and $242.
When aggregating all 10-week sequences in the dataset, ABBV stock would mostly be expected to range between $220 and $236, with probability density most elevated at $230. Therefore, while most speculators may be eyeballing $230 as a natural target, our data suggests that we can push the needle to $240.
However, knowing where a stock will go is only part of the tale. The other part is knowing where it will likely not be.
Targeting the Balanced Wager
In the financial publication ecosystem, everyone attempts to answer where the target security may end up, which is an open-ended inquiry. What’s more instructive is where the stock will stop going. Such an answer implies a ceiling that the bulls are no longer willing to push. Theoretically, that would be the point where even the most optimistic buyers are tempted to become sellers.
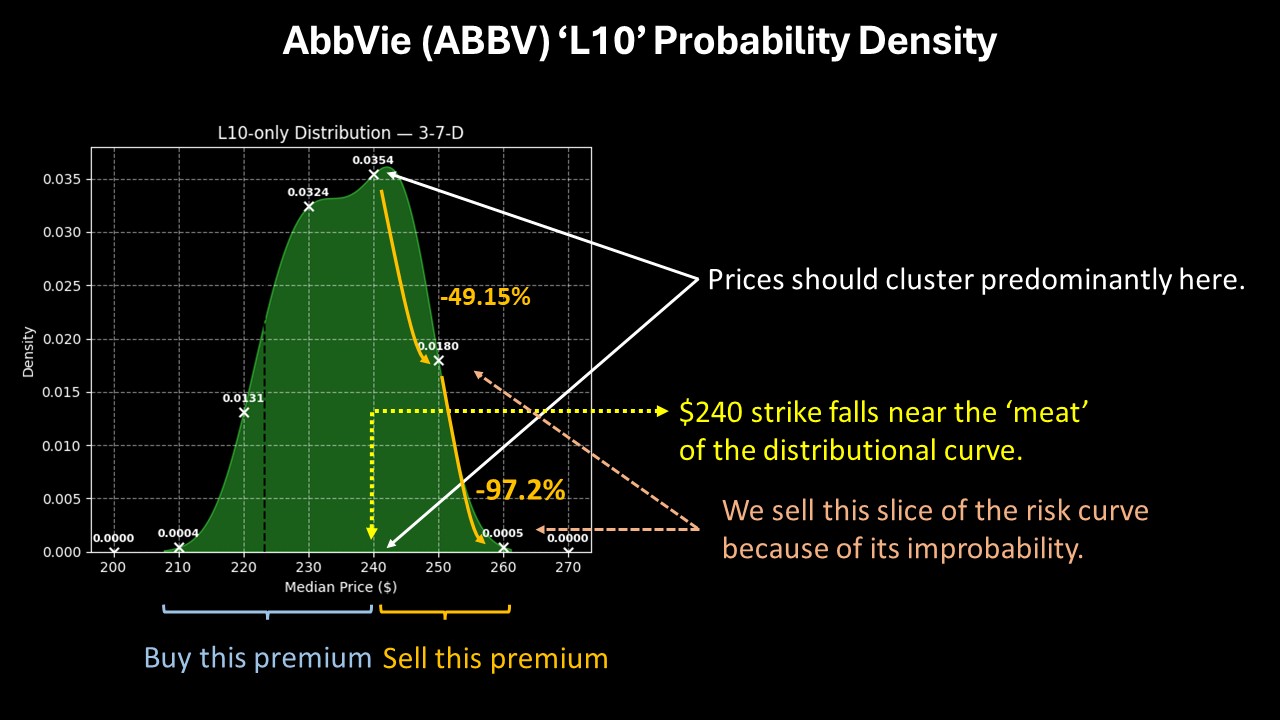
Based on the distributional analysis above of the 3-7-D sequence, this fulcrum stands at around $242. Beyond that point, probability density starts to drop rapidly — or to think of it differently, probability decay accelerates beyond the aforementioned price threshold.
Given this setup, the trade that would appear to make the most sense is the 230/240 bull call spread expiring Feb. 20, 2026. This wager requires ABBV stock to rise through the second-leg strike ($240) at expiration to receive the nearly 178% maximum payout.
Because of how options are priced, it’s clear that market makers believe AbbVie reaching $240 over the next 10 weeks is unrealistic; hence, the huge payout. However, this strike arguably balances reward efficiency with opportunity cost mitigation. Based on the available data, this is the spread to keep close tabs on.
On the date of publication, Josh Enomoto did not have (either directly or indirectly) positions in any of the securities mentioned in this article. All information and data in this article is solely for informational purposes. For more information please view the Barchart Disclosure Policy here.
More news from Barchart