
 To stimulate sagging NYSE: XPEV">electric vehicle (EV) sales, China unveiled a package of tax breaks valued at $72.3 billion (520 billion yuan) over the next four years. This initially caused a spike in shares of Chinese EV maker NIO Inc. (NYSE: NIO) as well as peers Xpeng Inc. (NASDAQ: XPEV) and Li Auto Inc. (NYSE: LI). However, NIO shares continued to fall lower afterward. NIO shares traded as high as $66.99 in January 2021 but have been on a heart-wrenching decline to $7.00 lows in May 2023.
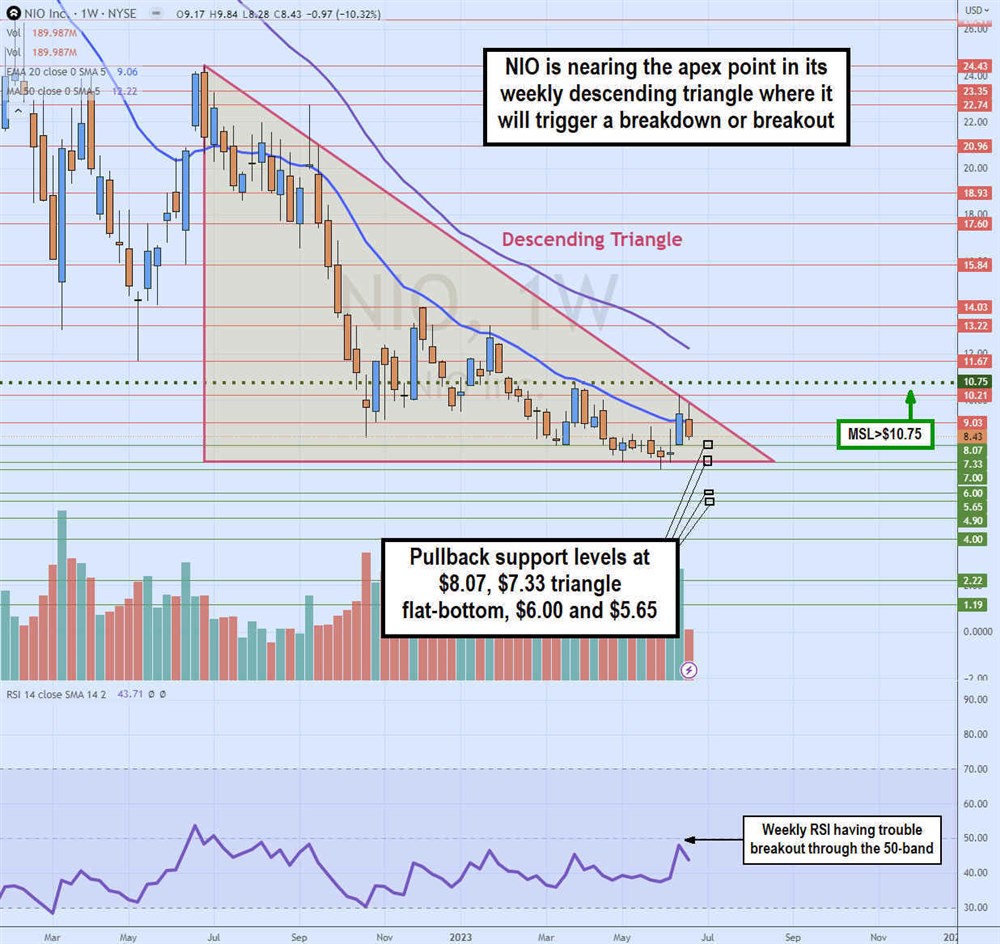
Shares are edging closer to the apex on their weekly descending triangle, setting up a resolution for a breakout or a breakdown in the coming weeks. The EV pricing wars have been a race to the bottom as NIO's Q1 2023 margins fell to a stunning low of 5.1%, down from 18.1% in the year-ago period.
Chinese NEV Tax Break Plan
Following up on its previous pledge to promote automobile purchases which showed a 7.3% jump in May auto sales, China introduced new tax breaks to purchase new energy vehicles (NEVs). The boost in auto sales resulted from targeted policies bolstering car purchases, including encouraging financial institutions to provide more lending for car purchases.
The new tax package exempts NEV purchase tax from 2024 to 2025 and cuts the purchase tax by 50% from 2026 to 2027. The 2024 to 2025 purchase tax can amount to as much as 30,000 yuan or $4,170 per car.
Cutting the purchase tax in half reduces the exemption value to 15,000 yuan or $2,085 from 2026 to 2027. This extension of the current NEV purchase tax exemption, worth around 115 billion yuan, is scheduled to end after 2023. China classifies NEVs are all-battery EVs (BEVs), plug-in petrol-electric hybrids and hydrogen fuel-cell vehicles (HFCVs.)
Raging Forest Fire Losses
On June 9, NIO released its fiscal first-quarter 2023 results for the quarter ending March 2023. NIO reported an EPS loss of ($0.36) which was $0.05 better than analyst expectations. Gross profit fell (88.8%) to $23.6 million YoY. Losses from operations climbed 133.6% YoY ($744.3 million). Net loss climbed 165.9% YoY to ($690.1 million).
The company reported revenues of $1.55 billion, up 7.7% year-over-year (YoY), but missed analyst estimates by ($80 million). Total deliveries in the quarter rose 20.1% to 31,041. Vehicle margin fell to 5.1%, down from 18.1%, and gross margins fell to 1.5% versus 14.6% in the year-ago period due to the EV pricing wars in China. The company ended the quarter with $5.5 billion in cash and short-term investments.
Glass Half-Full CEO
NIO CEO William Bin Li stayed optimistic, “On May 24, 2023, NIO launched the All-New ES6, an all-round smart electric SUV and started its deliveries the next day. With exquisite design, high performance, superior comfort, and advanced digital systems, the All-New ES6 has received overwhelmingly positive feedback from our users.
With the volume ramp-up of our new models, including the All-New ES6, our teams are well prepared for a solid growth in vehicle deliveries.” For Q2 2023, the company expects sequential vehicle delivery to decline from 23K to 25K. Revenues are expected between $1.27 billion to $1.36 billion, down (15.1%) to (9%) YoY.
NIO analyst ratings and price targets are at MarketBeat.
The definitive beginner’s guide to reading stock charts can be found free on Marketbeat.
Learn how to use the RSI indicator on MarketBeat.
Weekly Descending Triangle
The weekly candlestick chart on NIO has been downtrend after peeking at $24.43 in January 2022. Shares continued to make lower highs on bouncing, forming the descending trendline against a flat-bottom trendline around $7.22. The weekly RSI has been rejected at the 50-band since the start of the triangle.
The weekly market structure low (MSL) at $10.75 continues to be a formidable resistance as it has rejected breakout attempts as recently as June 12, 2023. The weekly 20-period exponential moving average (EMA) is flattening at $9.06. The apex point is nearing, so a breakdown or breakout is imminent. Pullback supports are at $8.07, $7.33 triangle flat-bottom trendline, $6.00 and $5.65.


