Regional bank Provident Financial Services (NYSE: PFS) beat Wall Street’s revenue expectations in Q3 CY2025, with sales up 5.3% year on year to $221.8 million. Its GAAP profit of $0.55 per share was in line with analysts’ consensus estimates.
Is now the time to buy Provident Financial Services? Find out by accessing our full research report, it’s free for active Edge members.
Provident Financial Services (PFS) Q3 CY2025 Highlights:
- Net Interest Income: $194.3 million vs analyst estimates of $193.8 million (5.8% year-on-year growth, in line)
- Net Interest Margin: 3.4% vs analyst estimates of 3.4% (3 basis point beat)
- Revenue: $221.8 million vs analyst estimates of $220.3 million (5.3% year-on-year growth, 0.7% beat)
- Efficiency Ratio: 51% vs analyst estimates of 51.6% (57.7 basis point beat)
- EPS (GAAP): $0.55 vs analyst estimates of $0.54 (in line)
- Tangible Book Value per Share: $15.13 vs analyst estimates of $14.96 (10.8% year-on-year growth, 1.1% beat)
- Market Capitalization: $2.42 billion
Anthony J. Labozzetta, President and Chief Executive Officer commented, “Provident continued to make progress on several strategic initiatives and delivered another impressive performance this quarter. We again achieved record revenues and pre-tax, pre-provision earnings by responsibly growing earning assets and deposits, while further improving operational efficiency and maintaining strong asset quality. We continued to invest in accomplished talent and technology and look forward to the sustained growth of our business and profitability.”
Company Overview
Founded in 1839 and serving communities across New Jersey, Pennsylvania, and New York, Provident Financial Services (NYSE: PFS) operates a regional bank providing commercial, residential, and consumer lending alongside wealth management and insurance services.
Sales Growth
Two primary revenue streams drive bank earnings. While net interest income, which is earned by charging higher rates on loans than paid on deposits, forms the foundation, fee-based services across banking, credit, wealth management, and trading operations provide additional income. Luckily, Provident Financial Services’s revenue grew at an incredible 18.3% compounded annual growth rate over the last five years. Its growth beat the average banking company and shows its offerings resonate with customers.
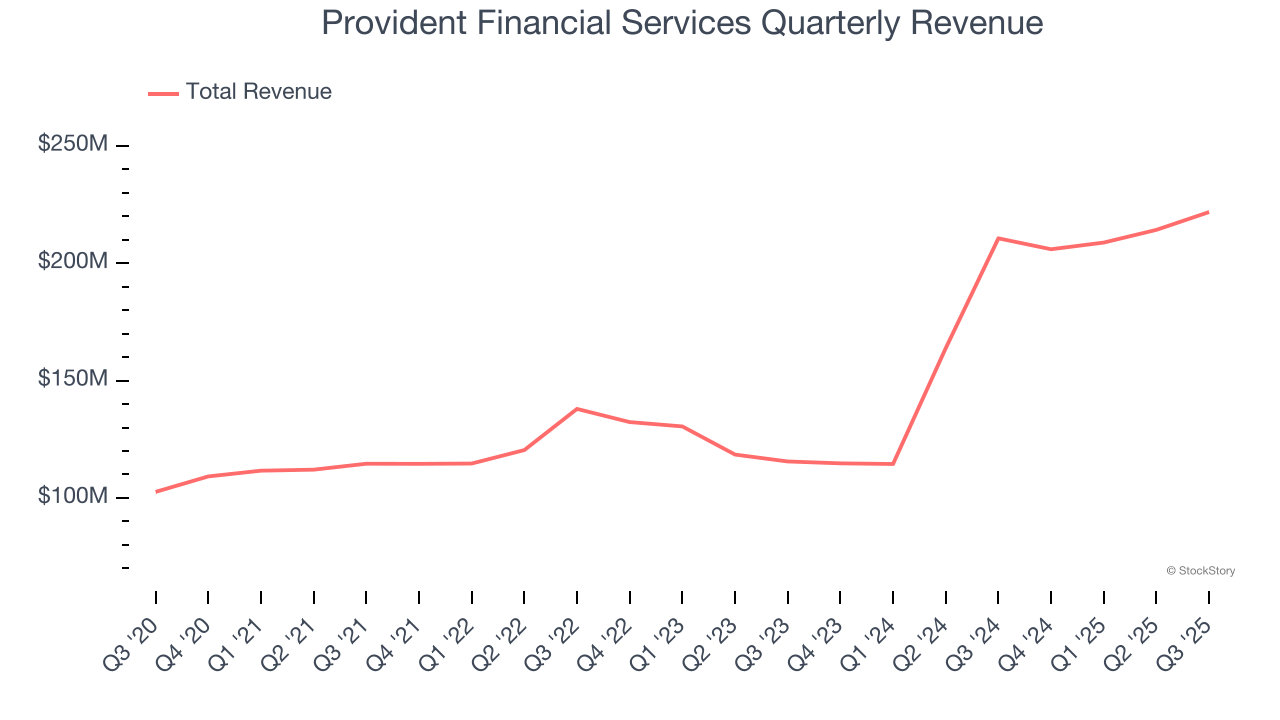
We at StockStory place the most emphasis on long-term growth, but within financials, a half-decade historical view may miss recent interest rate changes, market returns, and industry trends. Provident Financial Services’s annualized revenue growth of 30.8% over the last two years is above its five-year trend, suggesting its demand was strong and recently accelerated. 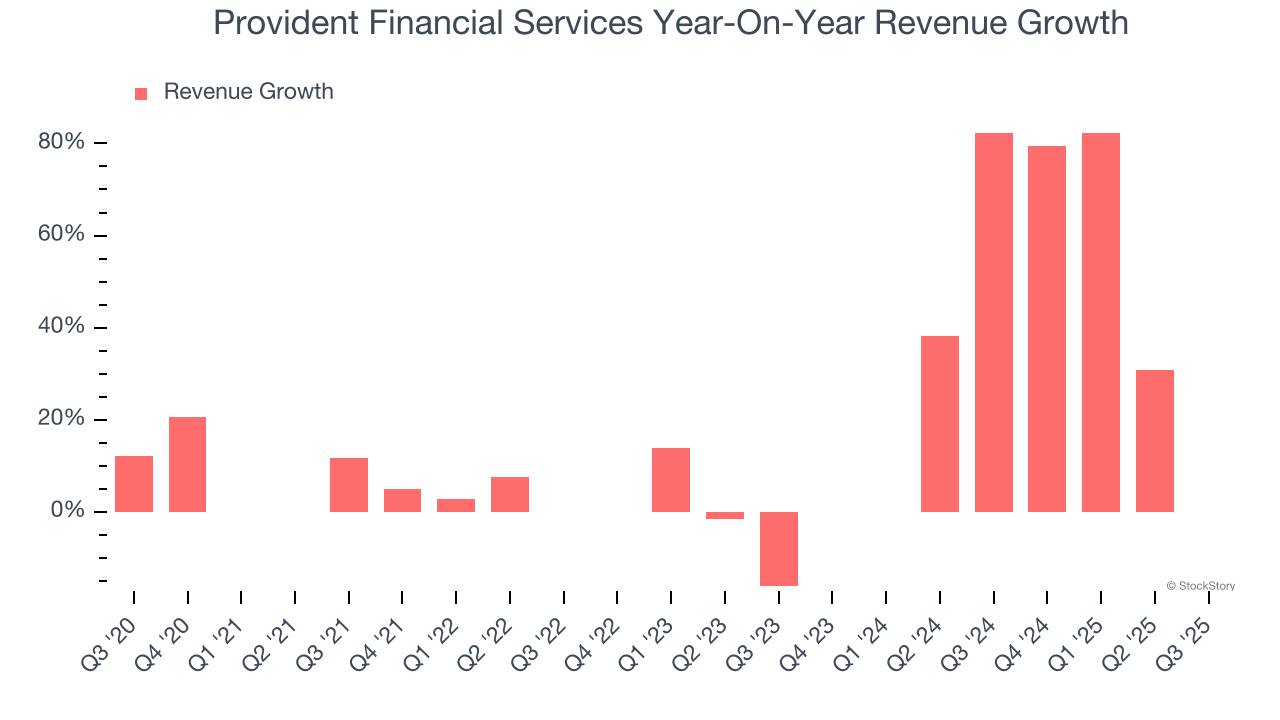 Note: Quarters not shown were determined to be outliers, impacted by outsized investment gains/losses that are not indicative of the recurring fundamentals of the business.
This quarter, Provident Financial Services reported year-on-year revenue growth of 5.3%, and its $221.8 million of revenue exceeded Wall Street’s estimates by 0.7%.
Net interest income made up 83.7% of the company’s total revenue during the last five years, meaning Provident Financial Services barely relies on non-interest income to drive its overall growth.
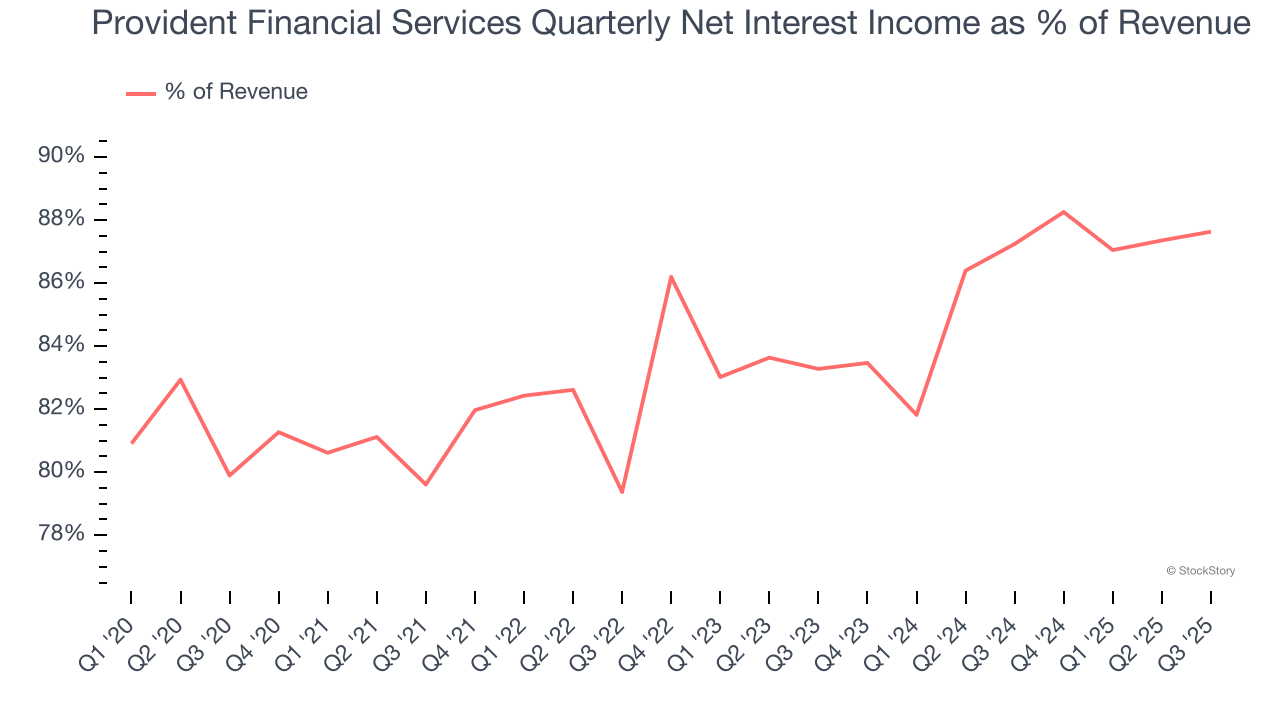
Our experience and research show the market cares primarily about a bank’s net interest income growth as non-interest income is considered a lower-quality and non-recurring revenue source.
Here at StockStory, we certainly understand the potential of thematic investing. Diverse winners from Microsoft (MSFT) to Alphabet (GOOG), Coca-Cola (KO) to Monster Beverage (MNST) could all have been identified as promising growth stories with a megatrend driving the growth. So, in that spirit, we’ve identified a relatively under-the-radar profitable growth stock benefiting from the rise of AI, available to you FREE via this link.
Tangible Book Value Per Share (TBVPS)
Banks profit by intermediating between depositors and borrowers, making them fundamentally balance sheet-driven enterprises. Market participants emphasize balance sheet quality and sustained book value growth when evaluating these institutions.
Because of this, tangible book value per share (TBVPS) emerges as the critical performance benchmark. By excluding intangible assets with uncertain liquidation values, this metric captures real, liquid net worth per share. EPS can become murky due to acquisition impacts or accounting flexibility around loan provisions, and TBVPS resists financial engineering manipulation.
Provident Financial Services’s TBVPS was flat over the last five years. A turnaround doesn’t seem to be in sight as its TBVPS also dropped by 1.3% annually over the last two years ($15.54 to $15.13 per share).
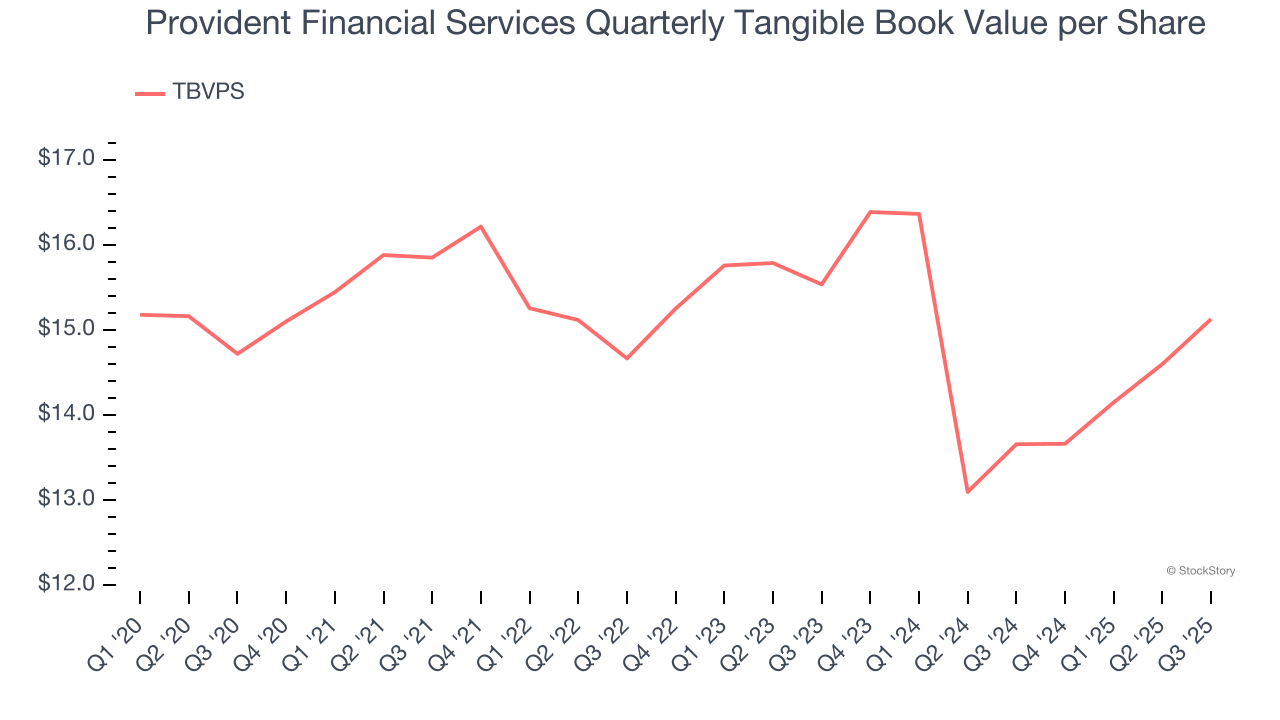
Over the next 12 months, Consensus estimates call for Provident Financial Services’s TBVPS to grow by 9.2% to $16.52, decent growth rate.
Key Takeaways from Provident Financial Services’s Q3 Results
Net interest income, revenue, EPS, and tangible book value per share were all more or less in line with Wall Street’s estimates. Overall, this was a quarter without many surprises. The stock remained flat at $18.56 immediately following the results.
So do we think Provident Financial Services is an attractive buy at the current price? What happened in the latest quarter matters, but not as much as longer-term business quality and valuation, when deciding whether to invest in this stock. We cover that in our actionable full research report which you can read here, it’s free for active Edge members.