
Safety and specialty services provider APi (NYSE: APG) beat Wall Street’s revenue expectations in Q3 CY2025, with sales up 14.2% year on year to $2.09 billion. The company’s full-year revenue guidance of $7.88 billion at the midpoint came in 1.6% above analysts’ estimates. Its non-GAAP profit of $0.41 per share was 3.7% above analysts’ consensus estimates.
Is now the time to buy APi? Find out by accessing our full research report, it’s free for active Edge members.
APi (APG) Q3 CY2025 Highlights:
- Revenue: $2.09 billion vs analyst estimates of $2.01 billion (14.2% year-on-year growth, 3.9% beat)
- Adjusted EPS: $0.41 vs analyst estimates of $0.40 (3.7% beat)
- Adjusted EBITDA: $281 million vs analyst estimates of $276.6 million (13.5% margin, 1.6% beat)
- The company lifted its revenue guidance for the full year to $7.88 billion at the midpoint from $7.75 billion, a 1.6% increase
- EBITDA guidance for the full year is $1.03 billion at the midpoint, in line with analyst expectations
- Operating Margin: 7.8%, in line with the same quarter last year
- Free Cash Flow Margin: 9.6%, down from 10.8% in the same quarter last year
- Organic Revenue rose 9.7% year on year vs analyst estimates of 6.3% growth (340.5 basis point beat)
- Market Capitalization: $14.33 billion
Russ Becker, APi’s President and Chief Executive Officer stated: “We approach 2026 with strong momentum across our global platform. We continue to accelerate organic growth while expanding adjusted EBITDA margins, growing our recurring inspection, service and monitoring business, building on our record backlog, and improving our free cash flow generation. We believe our proven operating model, built on our inspection and service-first strategy, purpose-driven leadership, and a disciplined approach to capital allocation, positions APi for sustained organic growth, margin expansion and value-accretive M&A. We are confident in our leaders’ ability to execute our strategy and deliver against our new 10/16/60+ financial targets, creating value for all our stakeholders. "
Company Overview
Started in 1926 as an insulation contractor, APi (NYSE: APG) provides life safety solutions and specialty services for buildings and infrastructure.
Revenue Growth
Examining a company’s long-term performance can provide clues about its quality. Even a bad business can shine for one or two quarters, but a top-tier one grows for years. Over the last five years, APi grew its sales at an incredible 16.6% compounded annual growth rate. Its growth beat the average industrials company and shows its offerings resonate with customers.
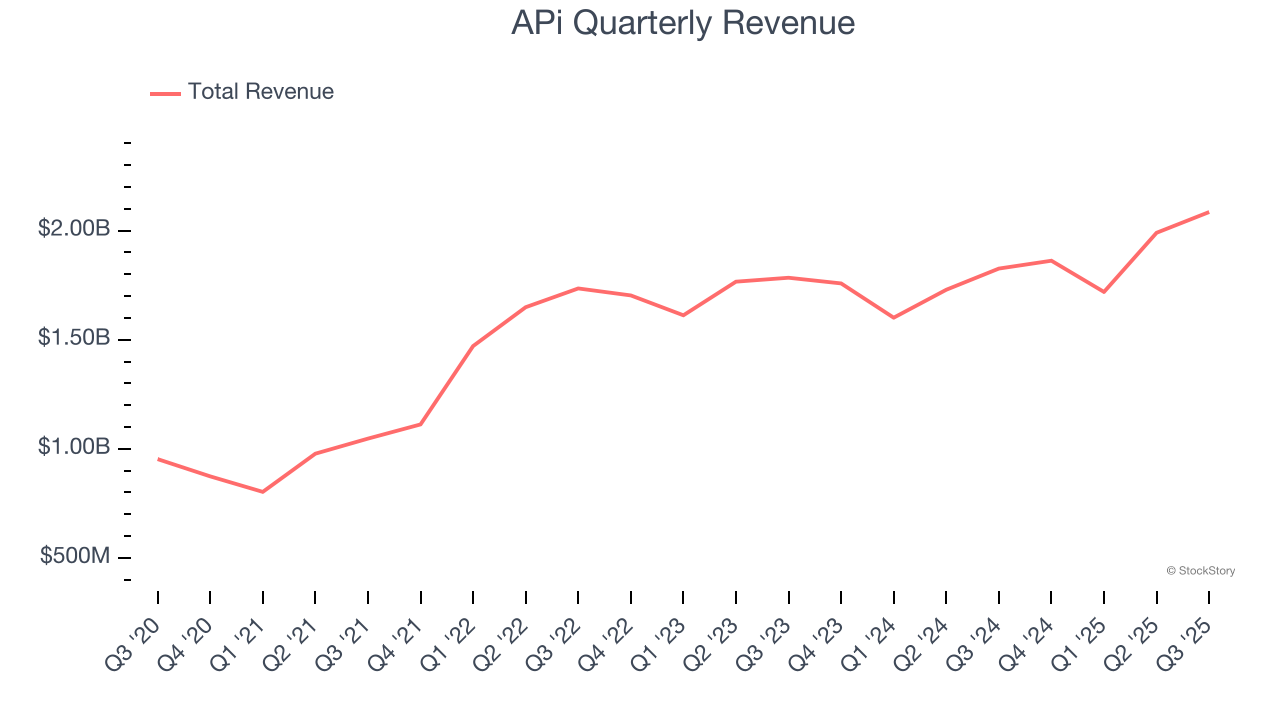
We at StockStory place the most emphasis on long-term growth, but within industrials, a half-decade historical view may miss cycles, industry trends, or a company capitalizing on catalysts such as a new contract win or a successful product line. APi’s recent performance shows its demand has slowed significantly as its annualized revenue growth of 5.6% over the last two years was well below its five-year trend. 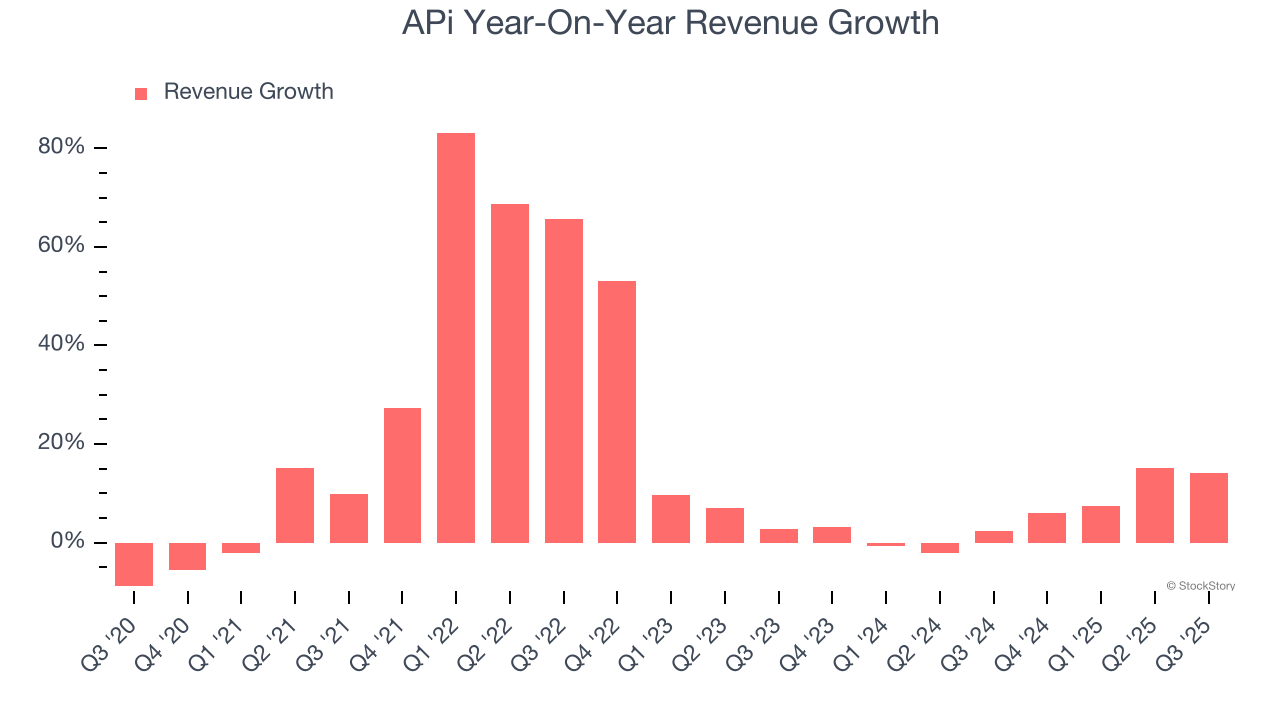
APi also reports organic revenue, which strips out one-time events like acquisitions and currency fluctuations that don’t accurately reflect its fundamentals. Over the last two years, APi’s organic revenue averaged 2.2% year-on-year growth. Because this number is lower than its two-year revenue growth, we can see that some mixture of acquisitions and foreign exchange rates boosted its headline results. 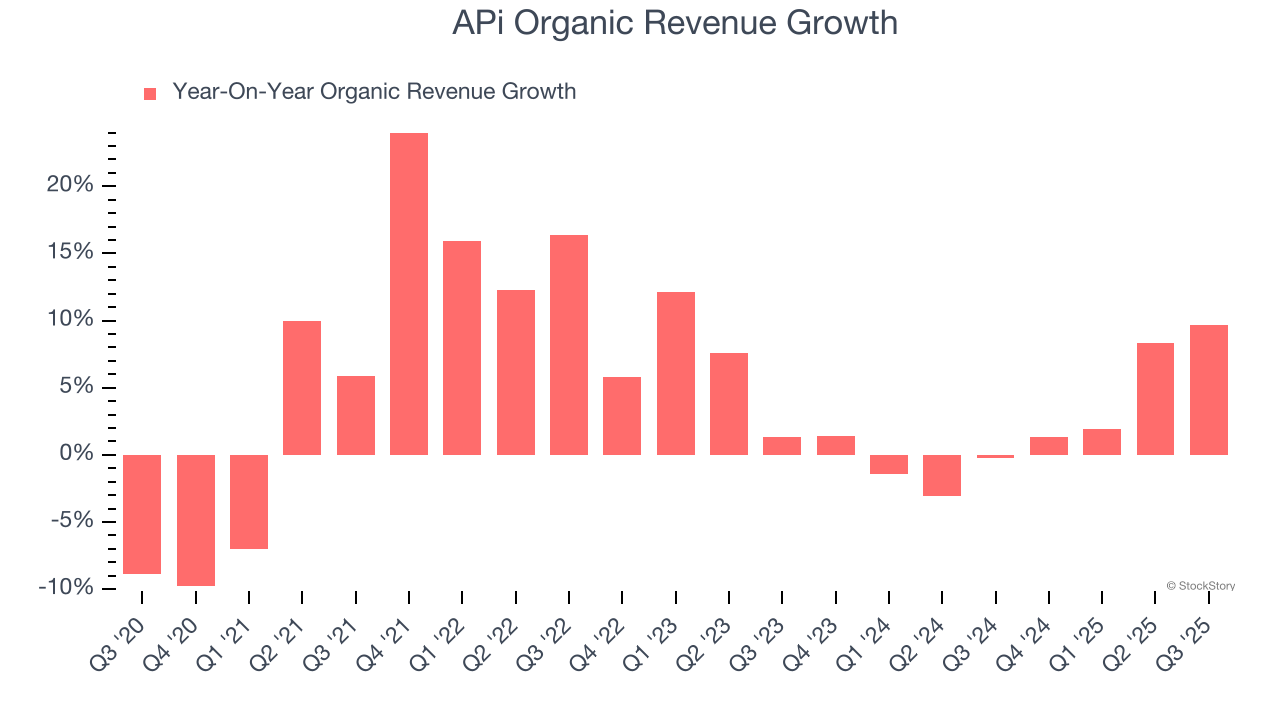
This quarter, APi reported year-on-year revenue growth of 14.2%, and its $2.09 billion of revenue exceeded Wall Street’s estimates by 3.9%.
Looking ahead, sell-side analysts expect revenue to grow 5.4% over the next 12 months, similar to its two-year rate. This projection is underwhelming and implies its newer products and services will not catalyze better top-line performance yet.
Software is eating the world and there is virtually no industry left that has been untouched by it. That drives increasing demand for tools helping software developers do their jobs, whether it be monitoring critical cloud infrastructure, integrating audio and video functionality, or ensuring smooth content streaming. Click here to access a free report on our 3 favorite stocks to play this generational megatrend.
Operating Margin
Operating margin is an important measure of profitability as it shows the portion of revenue left after accounting for all core expenses – everything from the cost of goods sold to advertising and wages. It’s also useful for comparing profitability across companies with different levels of debt and tax rates because it excludes interest and taxes.
APi was profitable over the last five years but held back by its large cost base. Its average operating margin of 4.8% was weak for an industrials business. This result isn’t too surprising given its low gross margin as a starting point.
On the plus side, APi’s operating margin rose by 4.9 percentage points over the last five years, as its sales growth gave it operating leverage.
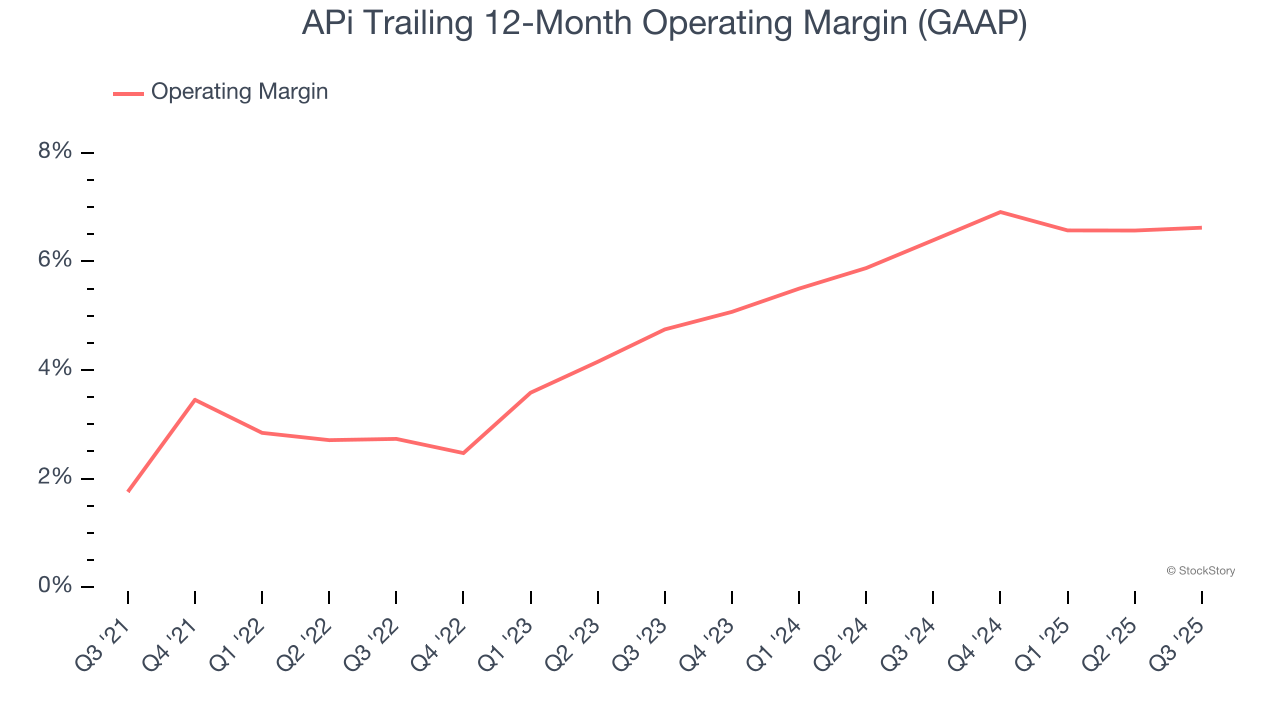
In Q3, APi generated an operating margin profit margin of 7.8%, in line with the same quarter last year. This indicates the company’s cost structure has recently been stable.
Earnings Per Share
We track the long-term change in earnings per share (EPS) for the same reason as long-term revenue growth. Compared to revenue, however, EPS highlights whether a company’s growth is profitable.
APi’s EPS grew at an unimpressive 6.8% compounded annual growth rate over the last five years, lower than its 16.6% annualized revenue growth. However, its operating margin actually improved during this time, telling us that non-fundamental factors such as interest expenses and taxes affected its ultimate earnings.
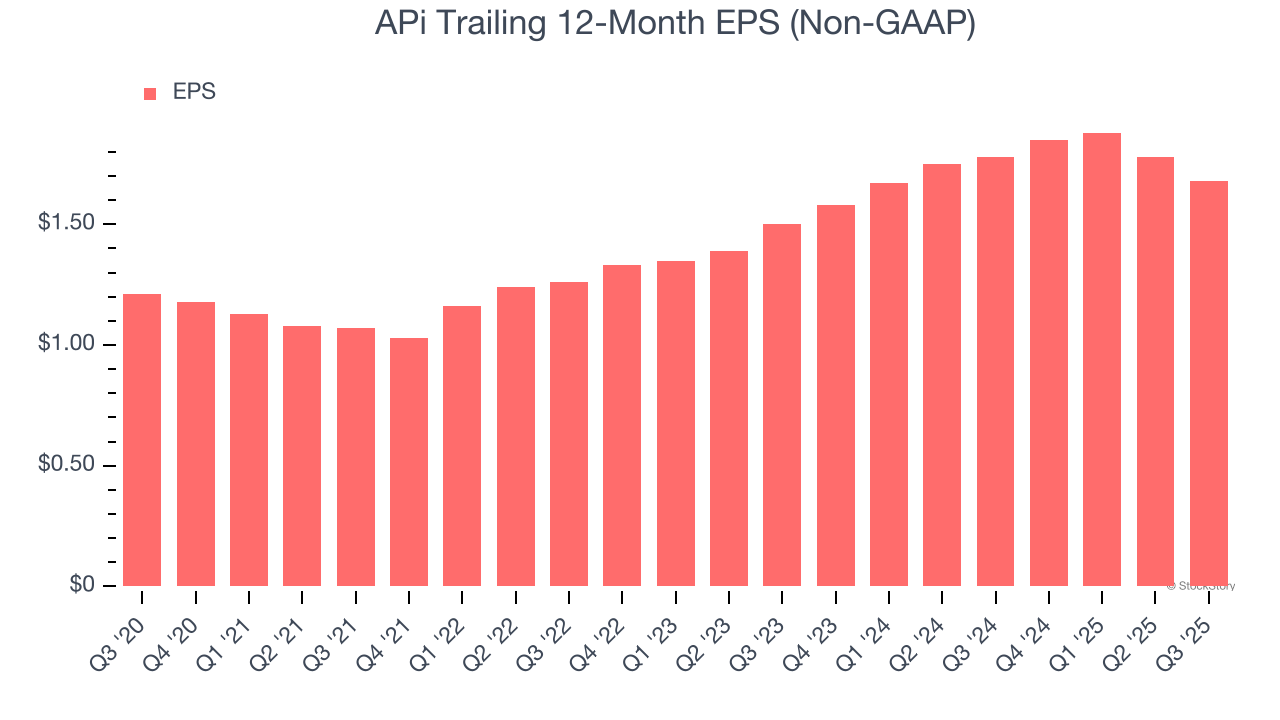
We can take a deeper look into APi’s earnings to better understand the drivers of its performance. A five-year view shows APi has diluted its shareholders, growing its share count by 57.1%. This dilution overshadowed its increased operational efficiency and has led to lower per share earnings. Taxes and interest expenses can also affect EPS but don’t tell us as much about a company’s fundamentals. 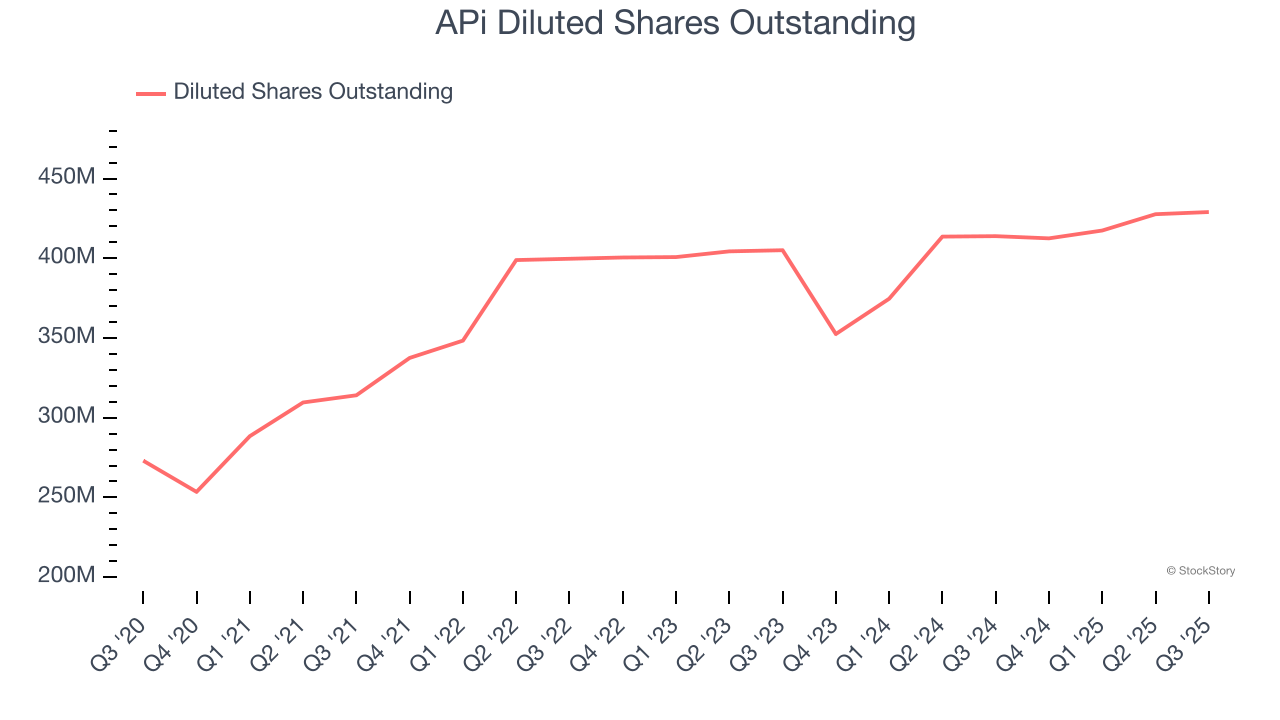
Like with revenue, we analyze EPS over a shorter period to see if we are missing a change in the business.
For APi, its two-year annual EPS growth of 5.8% is similar to its five-year trend, implying stable earnings.
In Q3, APi reported adjusted EPS of $0.41, down from $0.51 in the same quarter last year. Despite falling year on year, this print beat analysts’ estimates by 3.7%. Over the next 12 months, Wall Street expects APi’s full-year EPS of $1.68 to shrink by 5.7%.
Key Takeaways from APi’s Q3 Results
We were impressed by how significantly APi blew past analysts’ organic revenue expectations this quarter. We were also excited its revenue outperformed Wall Street’s estimates by a wide margin. Zooming out, we think this was a solid print. The stock traded up 4.2% to $35.90 immediately after reporting.
APi may have had a good quarter, but does that mean you should invest right now? If you’re making that decision, you should consider the bigger picture of valuation, business qualities, as well as the latest earnings. We cover that in our actionable full research report which you can read here, it’s free for active Edge members.


