Automotive manufacturer General Motors (NYSE: GM) beat Wall Street’s revenue expectations in Q2 CY2025, but sales fell by 1.8% year on year to $47.12 billion. Its non-GAAP profit of $2.53 per share was 2.1% above analysts’ consensus estimates.
Is now the time to buy General Motors? Find out by accessing our full research report, it’s free.
General Motors (GM) Q2 CY2025 Highlights:
- Revenue: $47.12 billion vs analyst estimates of $46.51 billion (1.8% year-on-year decline, 1.3% beat)
- Adjusted EPS: $2.53 vs analyst estimates of $2.48 (2.1% beat)
- Adjusted EPS guidance for the full year is $9.13 at the midpoint, missing analyst estimates by 1%
- Operating Margin: 4.5%, down from 8.1% in the same quarter last year
- Free Cash Flow Margin: 10.1%, up from 7.1% in the same quarter last year
- Market Capitalization: $51.16 billion
Company Overview
Founded in 1908 by William C. Durant, General Motors (NYSE: GM) offers a range of vehicles and automobiles through brands such as Chevrolet, Buick, GMC, and Cadillac.
Revenue Growth
A company’s long-term performance is an indicator of its overall quality. Any business can experience short-term success, but top-performing ones enjoy sustained growth for years. Over the last five years, General Motors grew its sales at a solid 10.1% compounded annual growth rate. Its growth beat the average industrials company and shows its offerings resonate with customers.
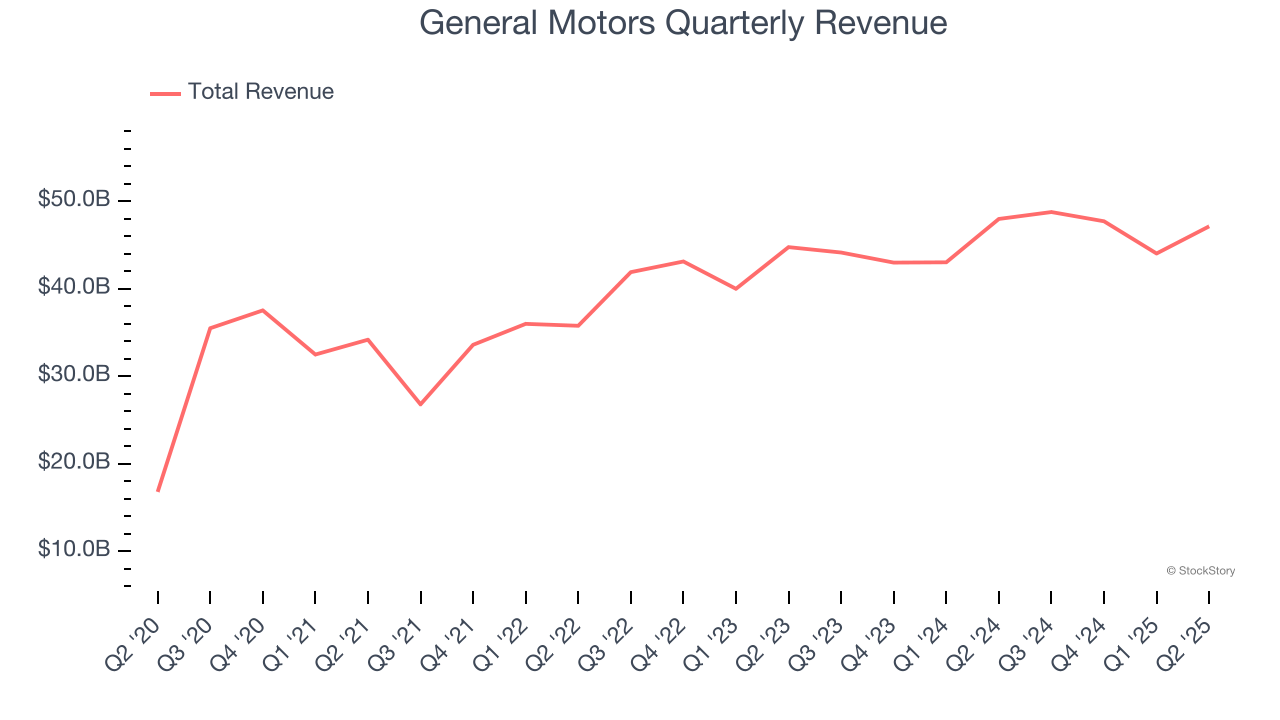
Long-term growth is the most important, but within industrials, a half-decade historical view may miss new industry trends or demand cycles. General Motors’s recent performance shows its demand has slowed as its annualized revenue growth of 5.1% over the last two years was below its five-year trend. 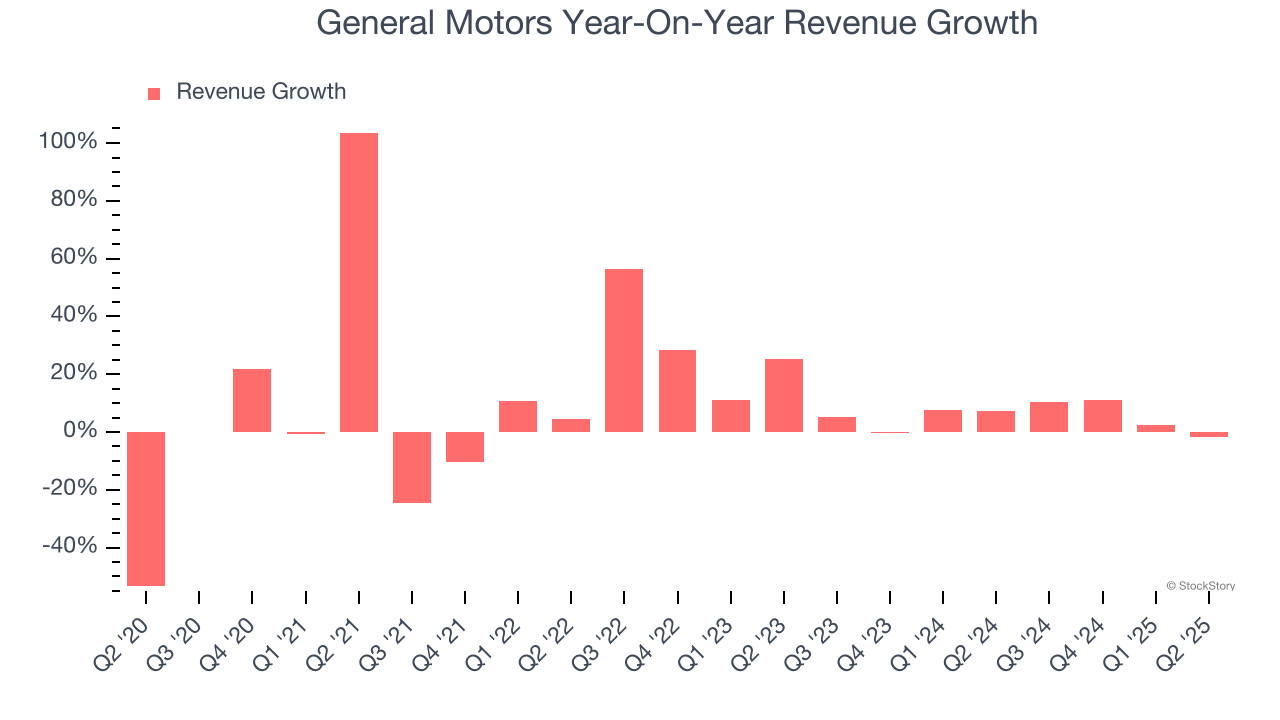
This quarter, General Motors’s revenue fell by 1.8% year on year to $47.12 billion but beat Wall Street’s estimates by 1.3%.
Looking ahead, sell-side analysts expect revenue to decline by 4.7% over the next 12 months, a deceleration versus the last two years. This projection is underwhelming and implies its products and services will see some demand headwinds.
Unless you’ve been living under a rock, it should be obvious by now that generative AI is going to have a huge impact on how large corporations do business. While Nvidia and AMD are trading close to all-time highs, we prefer a lesser-known (but still profitable) stock benefiting from the rise of AI. Click here to access our free report one of our favorites growth stories.
Operating Margin
General Motors was profitable over the last five years but held back by its large cost base. Its average operating margin of 6.7% was weak for an industrials business. This result isn’t too surprising given its low gross margin as a starting point.
Looking at the trend in its profitability, General Motors’s operating margin decreased by 3.9 percentage points over the last five years. This raises questions about the company’s expense base because its revenue growth should have given it leverage on its fixed costs, resulting in better economies of scale and profitability. General Motors’s performance was poor no matter how you look at it - it shows that costs were rising and it couldn’t pass them onto its customers.
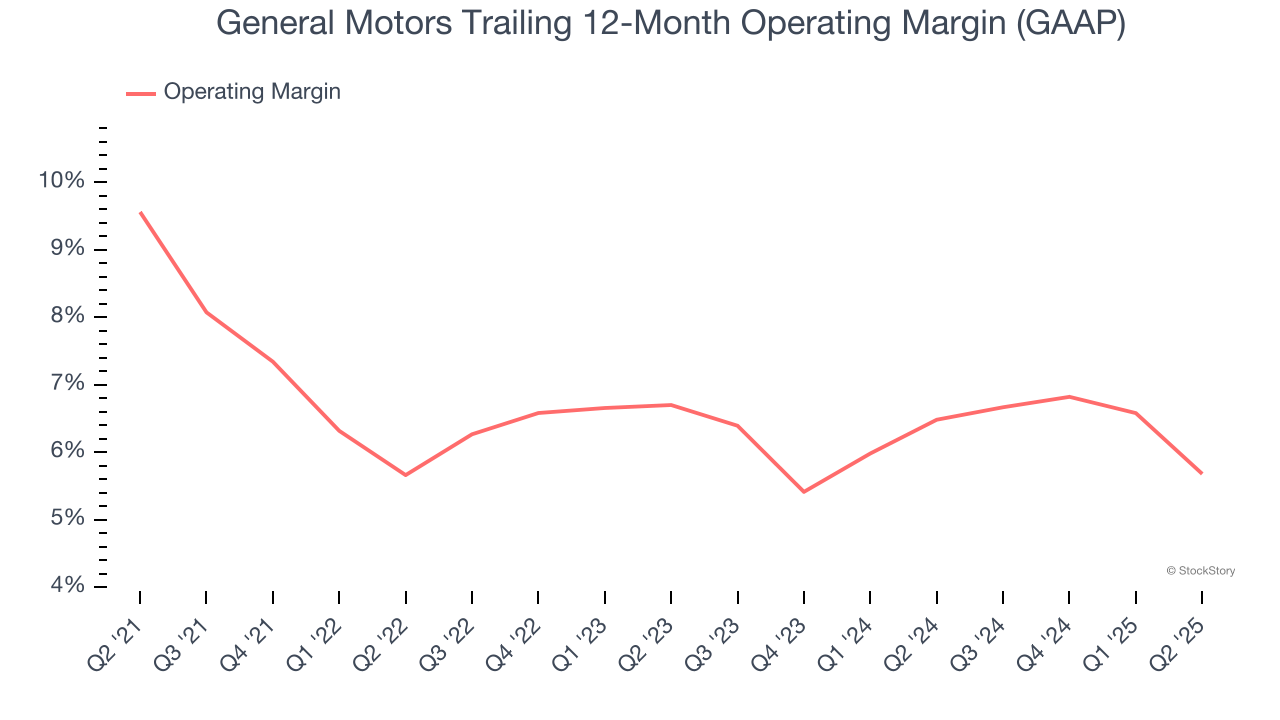
This quarter, General Motors generated an operating margin profit margin of 4.5%, down 3.6 percentage points year on year. The contraction shows it was less efficient because its expenses increased relative to its revenue.
Earnings Per Share
Revenue trends explain a company’s historical growth, but the long-term change in earnings per share (EPS) points to the profitability of that growth – for example, a company could inflate its sales through excessive spending on advertising and promotions.
General Motors’s EPS grew at an astounding 40.1% compounded annual growth rate over the last five years, higher than its 10.1% annualized revenue growth. This tells us the company became more profitable on a per-share basis as it expanded.
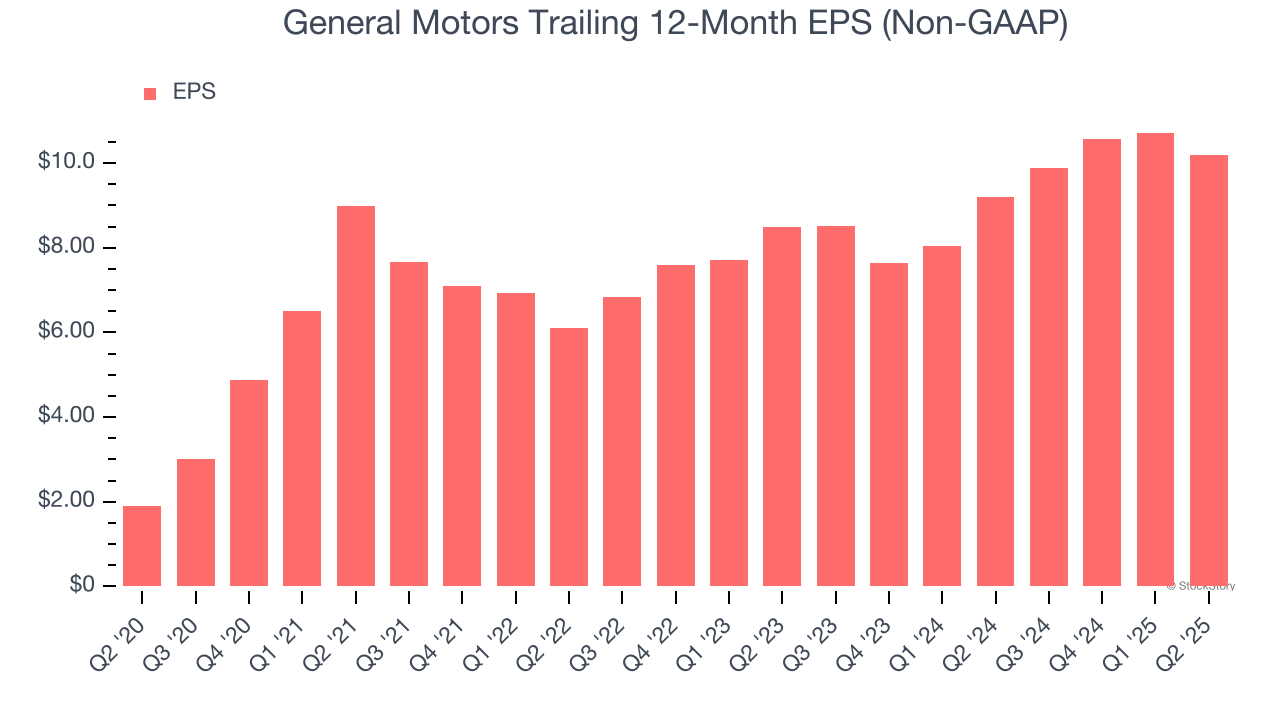
Like with revenue, we analyze EPS over a shorter period to see if we are missing a change in the business.
For General Motors, its two-year annual EPS growth of 9.6% was lower than its five-year trend. We hope its growth can accelerate in the future.
In Q2, General Motors reported EPS at $2.53, down from $3.06 in the same quarter last year. Despite falling year on year, this print beat analysts’ estimates by 2.1%. Over the next 12 months, Wall Street expects General Motors’s full-year EPS of $10.19 to shrink by 10.1%.
Key Takeaways from General Motors’s Q2 Results
It was good to see General Motors narrowly top analysts’ revenue expectations this quarter. On the other hand, its full-year EPS guidance slightly missed. Zooming out, we think this was a mixed quarter. The market seemed to be hoping for more, and the stock traded down 4.1% to $51.10 immediately following the results.
So do we think General Motors is an attractive buy at the current price? The latest quarter does matter, but not nearly as much as longer-term fundamentals and valuation, when deciding if the stock is a buy. We cover that in our actionable full research report which you can read here, it’s free.