Industrial conglomerate Crane (NYSE: CR) beat Wall Street’s revenue expectations in Q3 CY2025, with sales up 7.5% year on year to $589.2 million. Its non-GAAP profit of $1.64 per share was 10.3% above analysts’ consensus estimates.
Is now the time to buy Crane? Find out by accessing our full research report, it’s free for active Edge members.
Crane (CR) Q3 CY2025 Highlights:
- Revenue: $589.2 million vs analyst estimates of $580 million (7.5% year-on-year growth, 1.6% beat)
- Adjusted EPS: $1.64 vs analyst estimates of $1.49 (10.3% beat)
- Adjusted EBITDA: $133.9 million vs analyst estimates of $126.4 million (22.7% margin, 5.9% beat)
- Management raised its full-year Adjusted EPS guidance to $5.85 at the midpoint, a 3.5% increase
- Operating Margin: 20.1%, up from 18.1% in the same quarter last year
- Free Cash Flow Margin: 19.8%, up from 13.3% in the same quarter last year
- Organic Revenue rose 5.6% year on year vs analyst estimates of 3.4% growth (221.4 basis point beat)
- Market Capitalization: $11.04 billion
Max Mitchell, Crane's Chairman, President and Chief Executive Officer, stated: "We are proud to report another strong quarter, with adjusted EPS up 27% and core sales growth of 5.6%. This quarter’s earnings performance was ahead of our expectations, and further highlights our differentiated technology, commercial excellence focus and consistent operational discipline.
Company Overview
Based in Connecticut, Crane (NYSE: CR) is a diversified manufacturer of engineered industrial products, including fluid handling, and aerospace technologies.
Revenue Growth
A company’s long-term performance is an indicator of its overall quality. Any business can put up a good quarter or two, but many enduring ones grow for years. Crane struggled to consistently generate demand over the last five years as its sales dropped at a 5.2% annual rate. This wasn’t a great result and is a sign of lacking business quality.
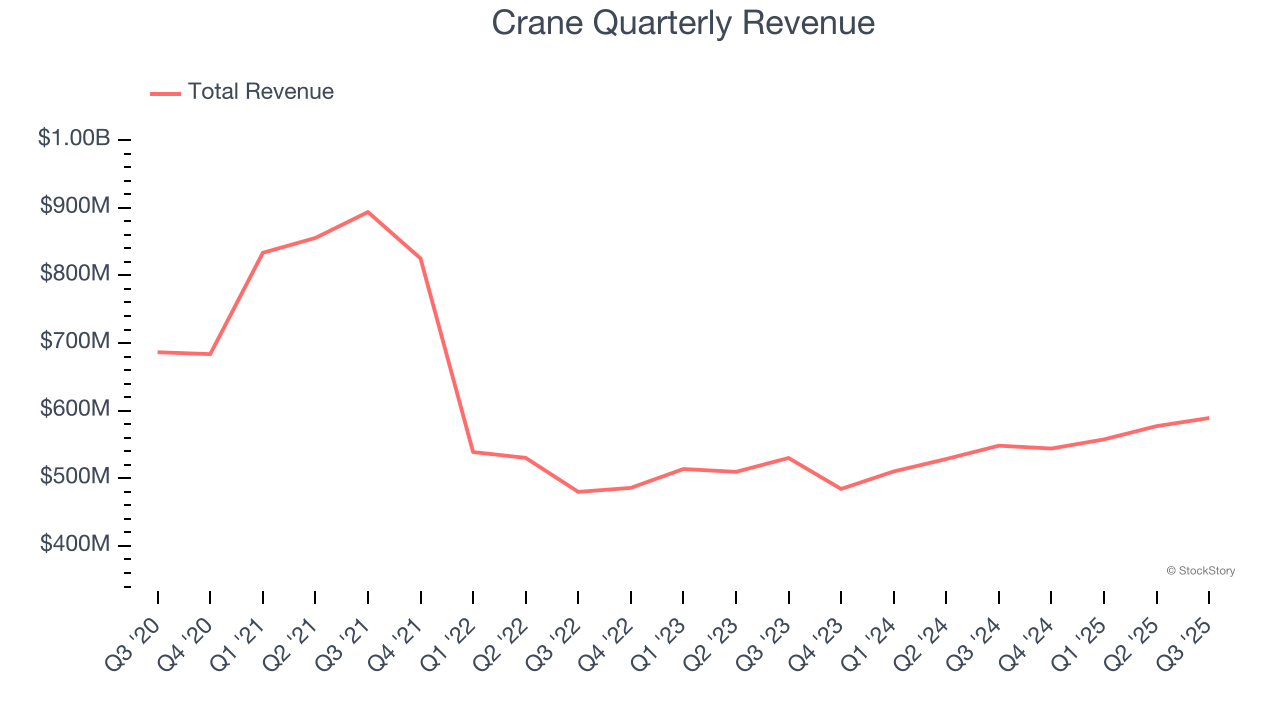
Long-term growth is the most important, but within industrials, a half-decade historical view may miss new industry trends or demand cycles. Crane’s annualized revenue growth of 5.5% over the last two years is above its five-year trend, but we were still disappointed by the results. 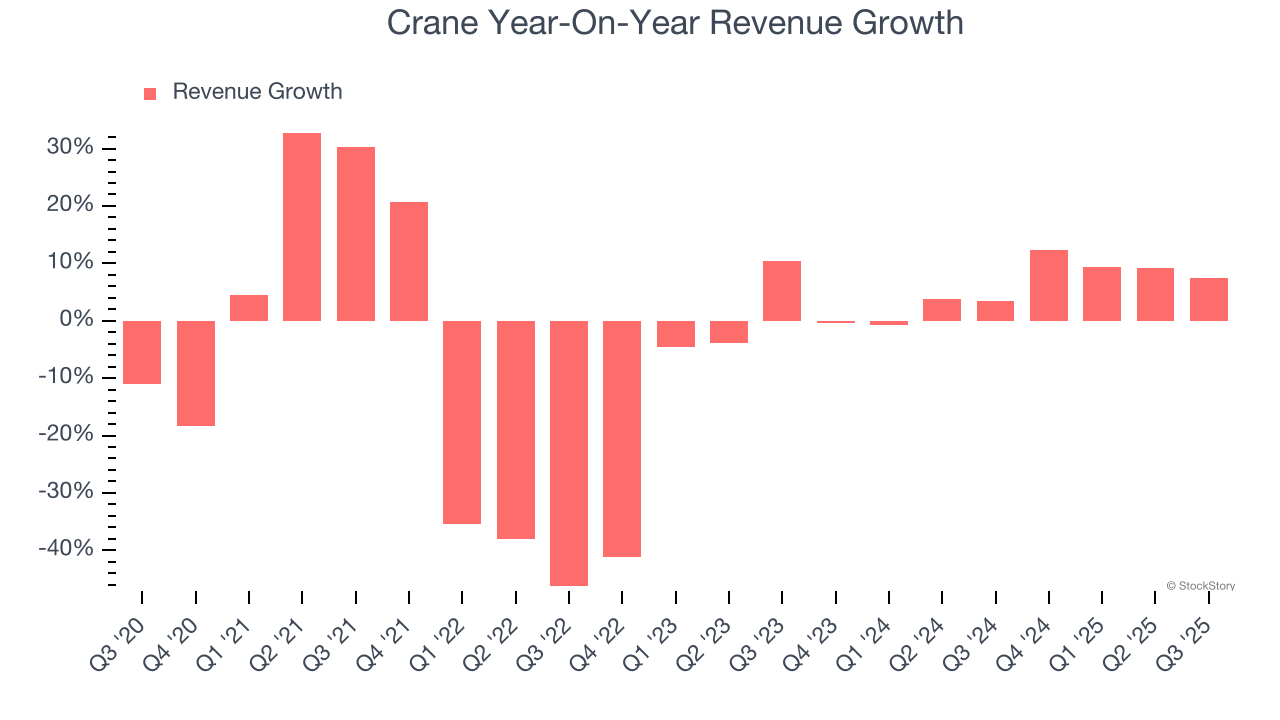
We can better understand the company’s sales dynamics by analyzing its organic revenue, which strips out one-time events like acquisitions and currency fluctuations that don’t accurately reflect its fundamentals. Over the last two years, Crane’s organic revenue averaged 6.6% year-on-year growth. Because this number aligns with its two-year revenue growth, we can see the company’s core operations (not acquisitions and divestitures) drove most of its results. 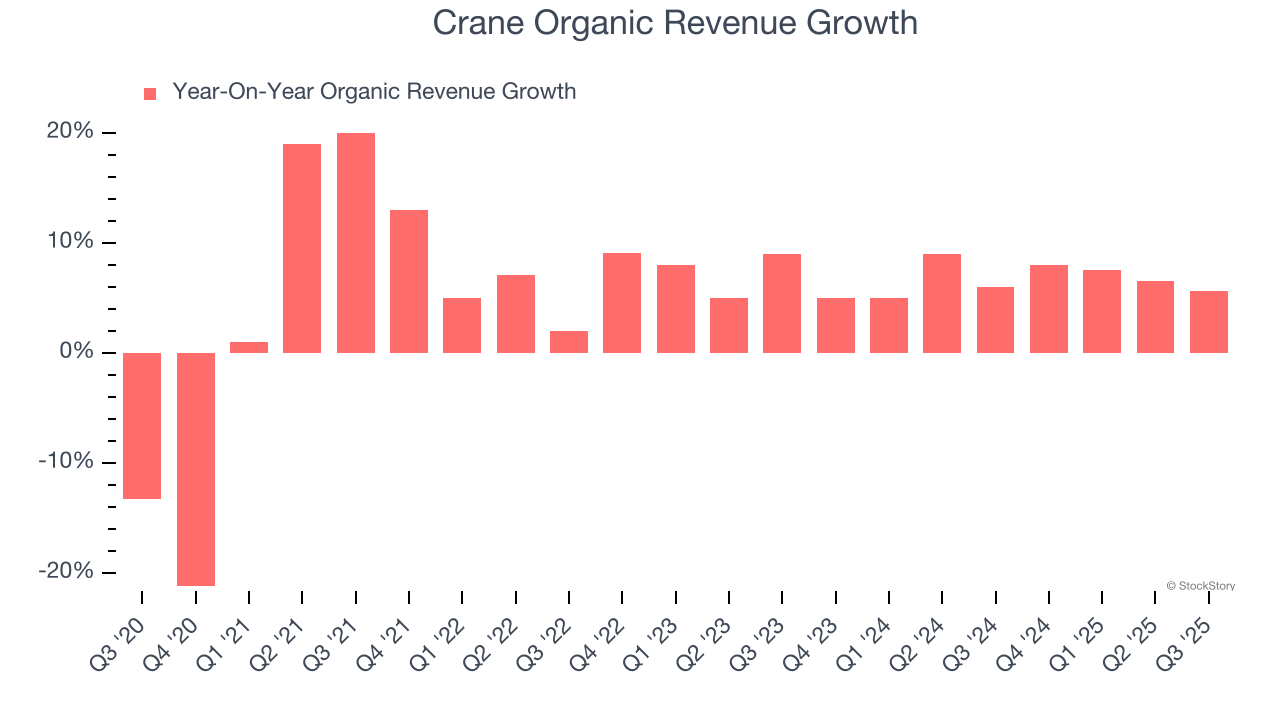
This quarter, Crane reported year-on-year revenue growth of 7.5%, and its $589.2 million of revenue exceeded Wall Street’s estimates by 1.6%.
Looking ahead, sell-side analysts expect revenue to grow 9.3% over the next 12 months, an improvement versus the last two years. This projection is noteworthy and implies its newer products and services will catalyze better top-line performance.
Here at StockStory, we certainly understand the potential of thematic investing. Diverse winners from Microsoft (MSFT) to Alphabet (GOOG), Coca-Cola (KO) to Monster Beverage (MNST) could all have been identified as promising growth stories with a megatrend driving the growth. So, in that spirit, we’ve identified a relatively under-the-radar profitable growth stock benefiting from the rise of AI, available to you FREE via this link.
Operating Margin
Operating margin is an important measure of profitability as it shows the portion of revenue left after accounting for all core expenses – everything from the cost of goods sold to advertising and wages. It’s also useful for comparing profitability across companies with different levels of debt and tax rates because it excludes interest and taxes.
Crane has been an efficient company over the last five years. It was one of the more profitable businesses in the industrials sector, boasting an average operating margin of 13.1%. This result isn’t surprising as its high gross margin gives it a favorable starting point.
Looking at the trend in its profitability, Crane’s operating margin rose by 3.2 percentage points over the last five years, showing its efficiency has improved.
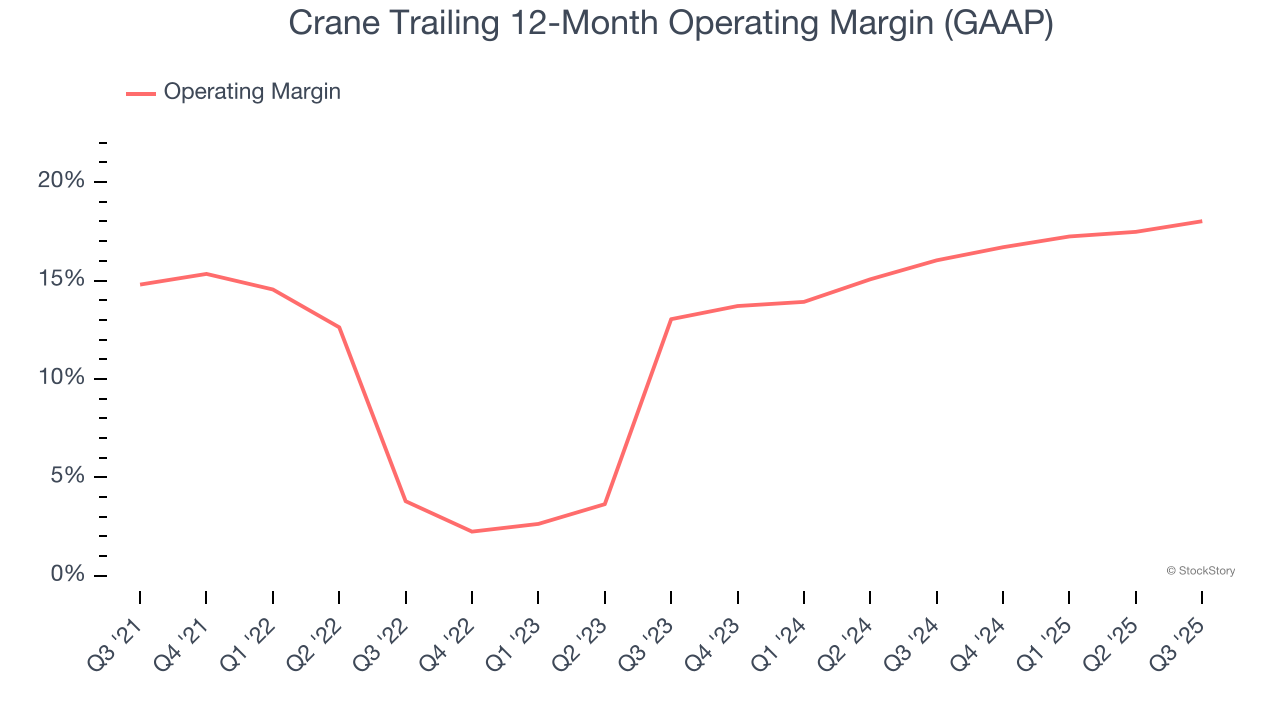
In Q3, Crane generated an operating margin profit margin of 20.1%, up 2 percentage points year on year. Since its gross margin expanded more than its operating margin, we can infer that leverage on its cost of sales was the primary driver behind the recently higher efficiency.
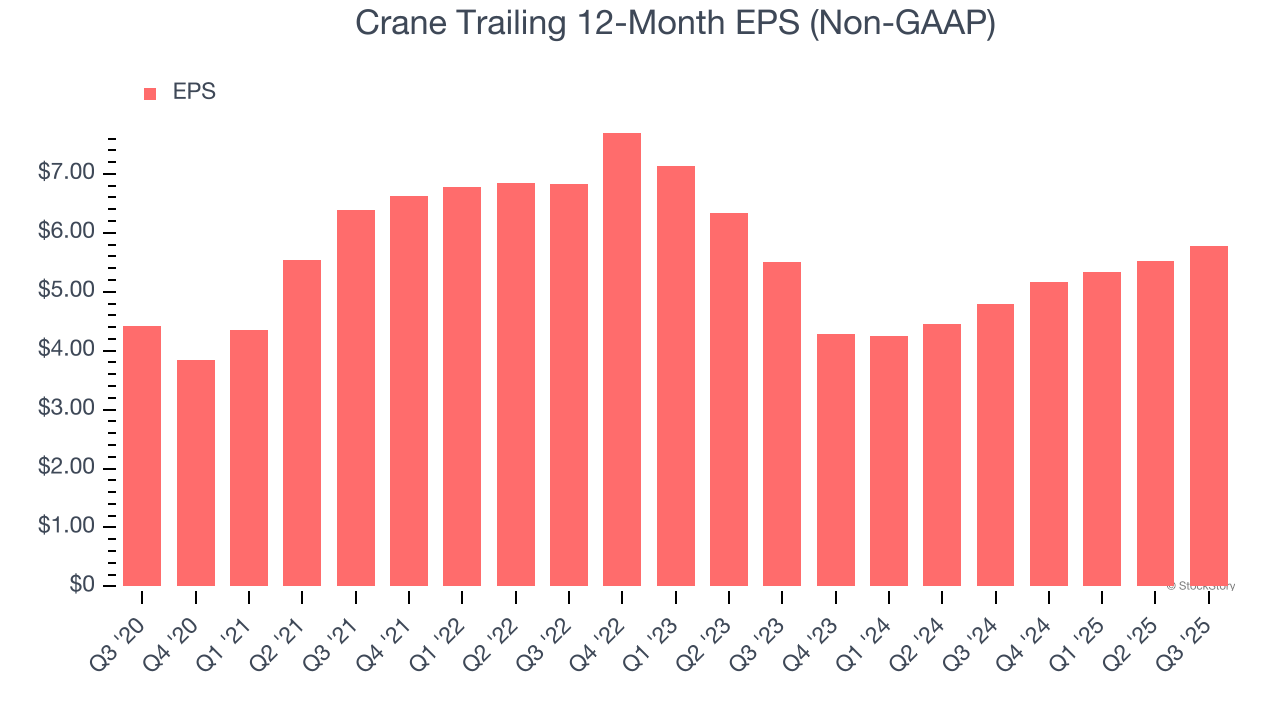
Earnings Per Share
Revenue trends explain a company’s historical growth, but the long-term change in earnings per share (EPS) points to the profitability of that growth – for example, a company could inflate its sales through excessive spending on advertising and promotions.
Crane’s EPS grew at an unimpressive 5.5% compounded annual growth rate over the last five years. On the bright side, this performance was better than its 5.2% annualized revenue declines and tells us management adapted its cost structure in response to a challenging demand environment.
Diving into the nuances of Crane’s earnings can give us a better understanding of its performance. As we mentioned earlier, Crane’s operating margin expanded by 3.2 percentage points over the last five years. This was the most relevant factor (aside from the revenue impact) behind its higher earnings; interest expenses and taxes can also affect EPS but don’t tell us as much about a company’s fundamentals.
Like with revenue, we analyze EPS over a more recent period because it can provide insight into an emerging theme or development for the business.
For Crane, its two-year annual EPS growth of 2.4% was lower than its five-year trend. We hope its growth can accelerate in the future.
In Q3, Crane reported adjusted EPS of $1.64, up from $1.38 in the same quarter last year. This print easily cleared analysts’ estimates, and shareholders should be content with the results. Over the next 12 months, Wall Street expects Crane’s full-year EPS of $5.78 to grow 6.8%.
Key Takeaways from Crane’s Q3 Results
We enjoyed seeing Crane beat analysts’ EBITDA expectations this quarter. We were also glad its organic revenue outperformed Wall Street’s estimates. Zooming out, we think this was a good print with some key areas of upside. The stock traded up 3.5% to $198 immediately after reporting.
Sure, Crane had a solid quarter, but if we look at the bigger picture, is this stock a buy? If you’re making that decision, you should consider the bigger picture of valuation, business qualities, as well as the latest earnings. We cover that in our actionable full research report which you can read here, it’s free for active Edge members.