Market Indicators
World Markets
More


Sector ETFs
More Sectors| Sector | % Change | YTD % |
|---|---|---|
| Basic Materials | -0.07% |
+19.63% |
| Consumer Goods | +1.28% |
+8.24% |
| Energy | +0.64% |
+25.68% |
| Financial Services | +0.76% |
-6.18% |
| Healthcare | +1.93% |
-6.07% |
| Industrial | -0.44% |
+4.96% |
| Technology | -1.24% |
+18.60% |
| Telecom | -0.43% |
+22.64% |
| Utilities | +0.29% |
+4.18% |
Market News
View More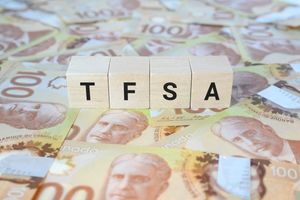
Where to Use Your $7,000 TFSA Contribution Room in 2026 ↗
Today 16:30 EDT

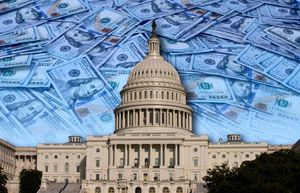
This TSX Shift Could Create a Huge Buying Opportunity ↗
Today 16:30 EDT

Is eBay About to Become a Meme Stock? ↗
Today 16:26 EDT


Currencies
More Currencies


More News
View More


Stock Quote API & Stock News API supplied by www.cloudquote.io
Quotes delayed at least 20 minutes.
By accessing this page, you agree to the Privacy Policy and Terms Of Service.
Quotes delayed at least 20 minutes.
By accessing this page, you agree to the Privacy Policy and Terms Of Service.
© 2025 FinancialContent. All rights reserved.