Aerospace and defense company General Dynamics (NYSE: GD) reported Q3 CY2025 results beating Wall Street’s revenue expectations, with sales up 10.6% year on year to $12.91 billion. Its GAAP profit of $3.88 per share was 4.6% above analysts’ consensus estimates.
Is now the time to buy General Dynamics? Find out by accessing our full research report, it’s free for active Edge members.
General Dynamics (GD) Q3 CY2025 Highlights:
- Revenue: $12.91 billion vs analyst estimates of $12.52 billion (10.6% year-on-year growth, 3.1% beat)
- EPS (GAAP): $3.88 vs analyst estimates of $3.71 (4.6% beat)
- Operating Margin: 10.3%, in line with the same quarter last year
- Free Cash Flow Margin: 14.7%, up from 10.4% in the same quarter last year
- Backlog: $109.9 billion at quarter end, up 18.6% year on year
- Market Capitalization: $91.72 billion
"Each of our four segments grew earnings and backlog in the quarter, reflecting solid execution coupled with growing demand," said Phebe Novakovic, chairman and chief executive officer.
Company Overview
Creator of the famous M1 Abrahms tank, General Dynamics (NYSE: GD) develops aerospace, marine systems, combat systems, and information technology products.
Revenue Growth
A company’s long-term performance is an indicator of its overall quality. Any business can put up a good quarter or two, but many enduring ones grow for years. Regrettably, General Dynamics’s sales grew at a mediocre 6.2% compounded annual growth rate over the last five years. This was below our standard for the industrials sector and is a rough starting point for our analysis.
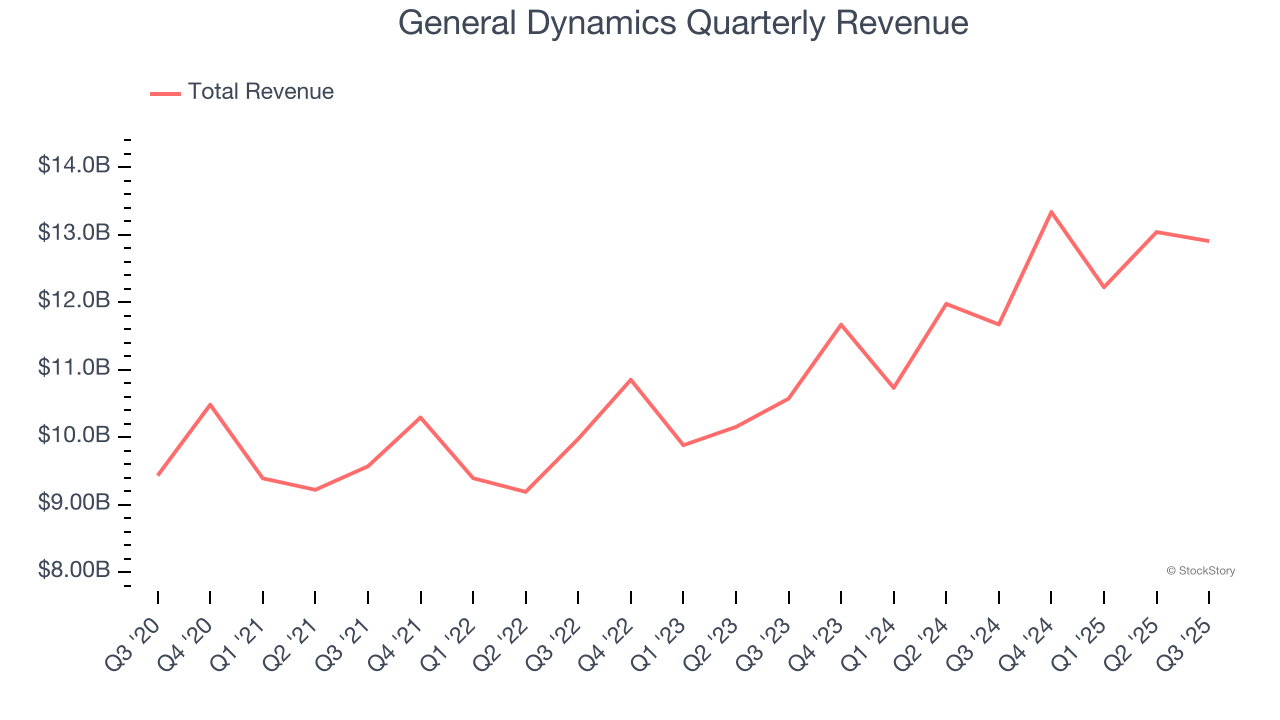
We at StockStory place the most emphasis on long-term growth, but within industrials, a half-decade historical view may miss cycles, industry trends, or a company capitalizing on catalysts such as a new contract win or a successful product line. General Dynamics’s annualized revenue growth of 11.5% over the last two years is above its five-year trend, suggesting its demand recently accelerated. 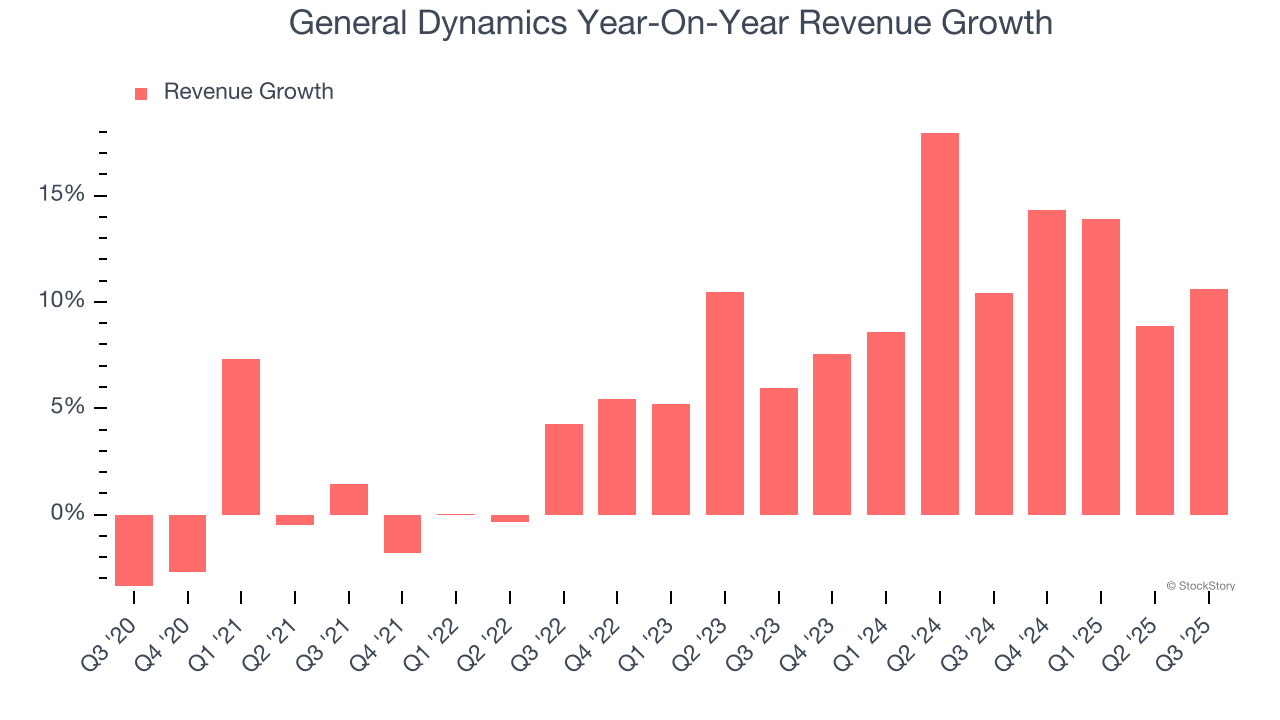
We can better understand the company’s revenue dynamics by analyzing its backlog, or the value of its outstanding orders that have not yet been executed or delivered. General Dynamics’s backlog reached $109.9 billion in the latest quarter and averaged 3.4% year-on-year growth over the last two years. Because this number is lower than its revenue growth, we can see the company fulfilled orders at a faster rate than it added new orders to the backlog. This implies General Dynamics was operating efficiently but raises questions about the health of its sales pipeline. 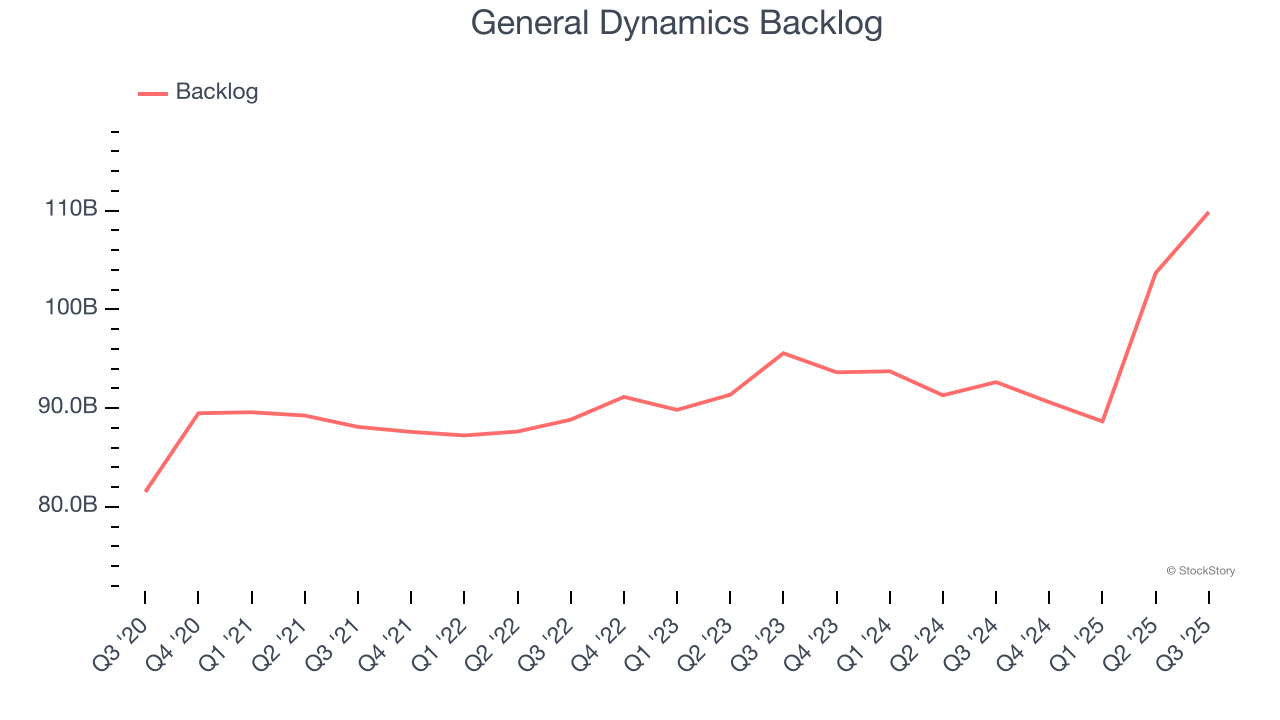
This quarter, General Dynamics reported year-on-year revenue growth of 10.6%, and its $12.91 billion of revenue exceeded Wall Street’s estimates by 3.1%.
Looking ahead, sell-side analysts expect revenue to grow 2.3% over the next 12 months, a deceleration versus the last two years. This projection doesn't excite us and implies its products and services will see some demand headwinds.
Software is eating the world and there is virtually no industry left that has been untouched by it. That drives increasing demand for tools helping software developers do their jobs, whether it be monitoring critical cloud infrastructure, integrating audio and video functionality, or ensuring smooth content streaming. Click here to access a free report on our 3 favorite stocks to play this generational megatrend.
Operating Margin
Operating margin is a key measure of profitability. Think of it as net income - the bottom line - excluding the impact of taxes and interest on debt, which are less connected to business fundamentals.
General Dynamics’s operating margin might fluctuated slightly over the last 12 months but has remained more or less the same, averaging 10.4% over the last five years. This profitability was solid for an industrials business and shows it’s an efficient company that manages its expenses well.
Looking at the trend in its profitability, General Dynamics’s operating margin might fluctuated slightly but has generally stayed the same over the last five years. This raises questions about the company’s expense base because its revenue growth should have given it leverage on its fixed costs, resulting in better economies of scale and profitability.
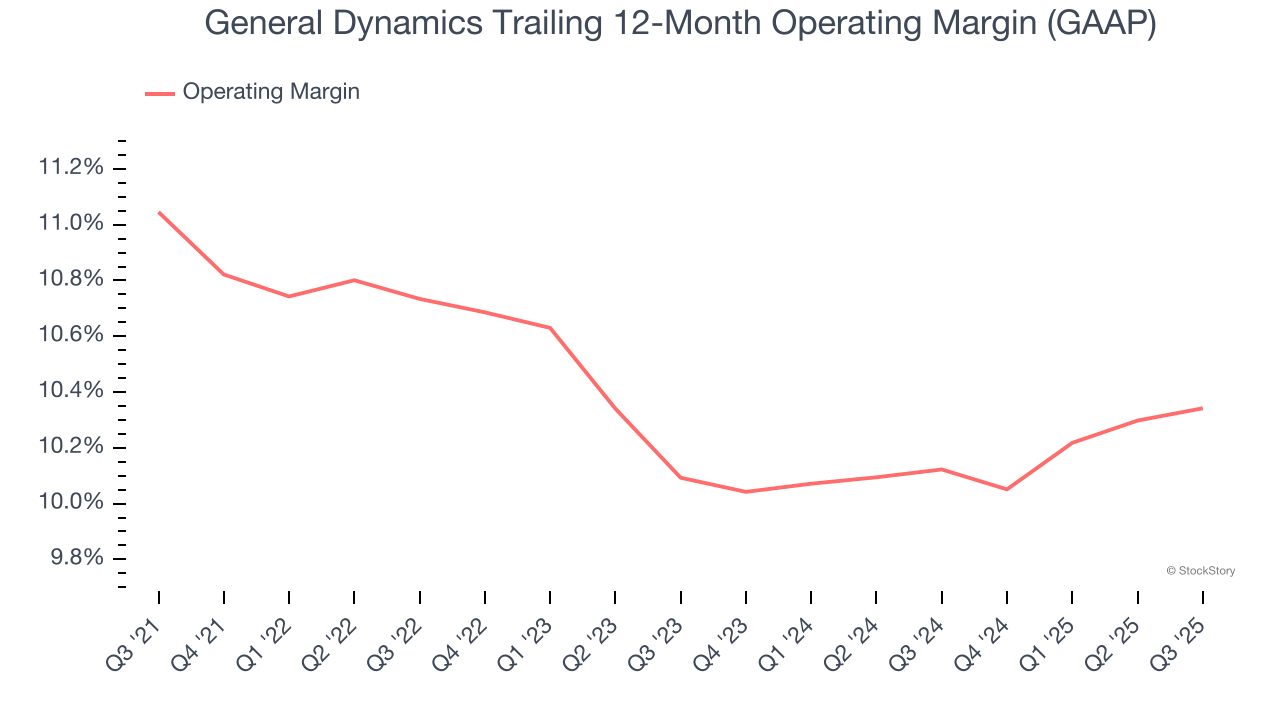
This quarter, General Dynamics generated an operating margin profit margin of 10.3%, in line with the same quarter last year. This indicates the company’s overall cost structure has been relatively stable.
Earnings Per Share
We track the long-term change in earnings per share (EPS) for the same reason as long-term revenue growth. Compared to revenue, however, EPS highlights whether a company’s growth is profitable.
General Dynamics’s unimpressive 7% annual EPS growth over the last five years aligns with its revenue performance. This tells us it maintained its per-share profitability as it expanded.
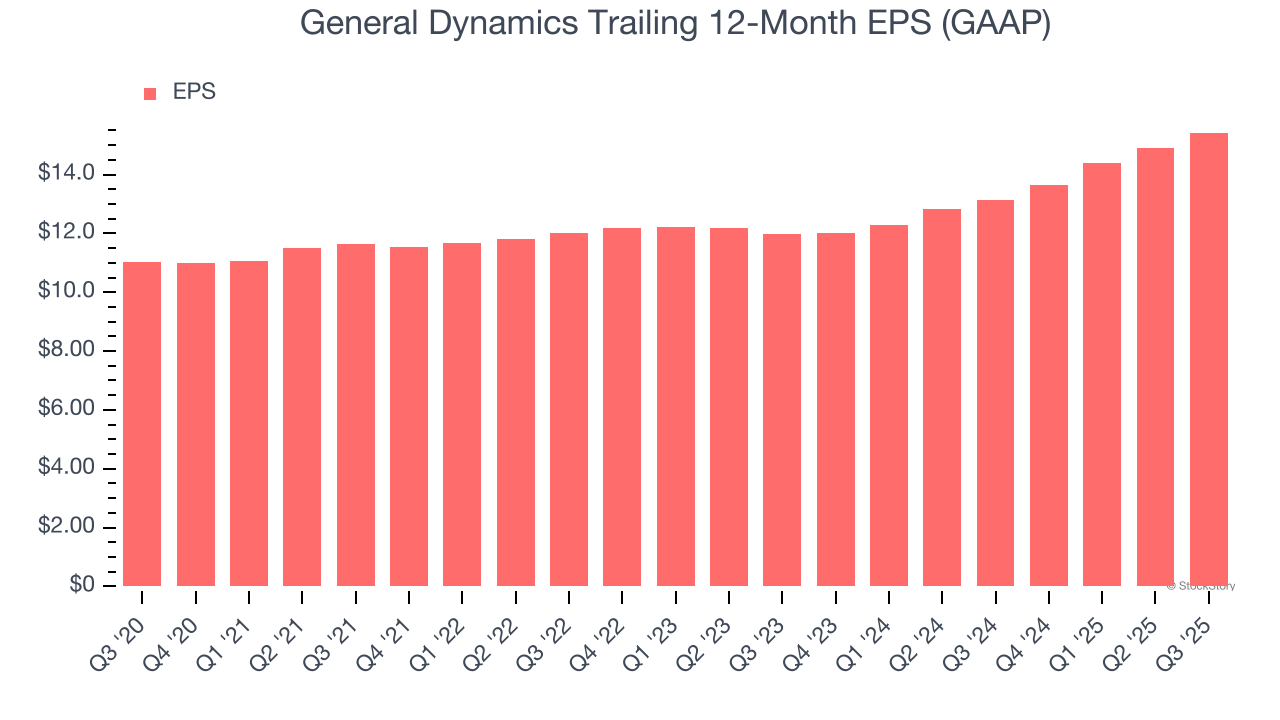
Like with revenue, we analyze EPS over a shorter period to see if we are missing a change in the business.
For General Dynamics, its two-year annual EPS growth of 13.5% was higher than its five-year trend. This acceleration made it one of the faster-growing industrials companies in recent history.
In Q3, General Dynamics reported EPS of $3.88, up from $3.35 in the same quarter last year. This print beat analysts’ estimates by 4.6%. Over the next 12 months, Wall Street expects General Dynamics’s full-year EPS of $15.43 to grow 6.4%.
Key Takeaways from General Dynamics’s Q3 Results
We were impressed by how significantly General Dynamics blew past analysts’ backlog expectations this quarter. We were also glad its revenue outperformed Wall Street’s estimates. Zooming out, we think this was a solid print. The stock traded up 1.5% to $346.50 immediately after reporting.
General Dynamics may have had a good quarter, but does that mean you should invest right now? The latest quarter does matter, but not nearly as much as longer-term fundamentals and valuation, when deciding if the stock is a buy. We cover that in our actionable full research report which you can read here, it’s free for active Edge members.