Figma, Inc. Class A Common Stock (NY:FIG)
Price and Volume
Detailed Quote| Volume | 14,702,792 |
| Open | 21.31 |
| Bid (Size) | 22.82 (500) |
| Ask (Size) | 22.87 (200) |
| Prev. Close | 21.48 |
| Today's Range | 21.25 - 23.09 |
| 52wk Range | 16.60 - 67.68 |
| Shares Outstanding | N/A |
| Dividend Yield | 1.30% |
Top News
More News

Performance
52-Week Range
66.0% below 52-week high
22.99
16.6052W Low
67.6852W High
1 Week
0.9% below 1-week high
21.081W Low
23.191W High
Figma, Inc. Class A Common Stock (FIG) traded between $16.60 and $67.68 over the past 52 weeks and last traded at $22.99, 66.0% below its 52-week high. Over the past week it ranged between $21.08 and $23.19.
Past 12 Months
1W
+$0.49
1M
-$0.89
3M
-$0.42
6M
+$2.67
YTD
-$14.62
1Y
-$40.83
FIG was -64.0% over the past year, +13.1% over six months, -38.9% year to date, +2.2% in the last week.
12 Months vs Market
FIG
-64.0%
DIA
+12.6%
SPY
+16.0%
QQQ
+20.9%
IWM
+9.9%
Over the past 12 months FIG returned -64.0% versus DIA (Dow) +12.6%, SPY (S&P 500) +16.0%, QQQ (Nasdaq 100) +20.9% and IWM (Russell 2000) +9.9%.
Volume & Liquidity
0.89× 3-mo avg
Today 14,702,792
3-mo avg 16.5M
1W
11.3M
1M
11.3M
3M
16.5M
6M
18.8M
YTD
17.2M
1Y
15.1M
FIG most recently traded 14,702,792 shares against a 3-month average daily volume of 16.5M.
More News
Read More
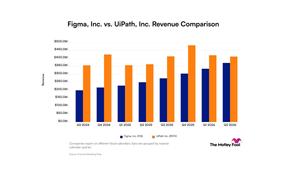

Figma vs. UiPath: Which Technology Stock Is a Better Buy in 2026? ↗
October 14, 2026


Figma vs. UiPath: Which Technology Stock Is a Better Buy in 2026? ↗
September 26, 2026

Figma vs. ServiceNow: Which Technology Stock Is a Better Buy in 2026? ↗
September 24, 2026

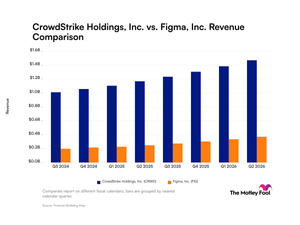
CrowdStrike vs. Figma: Which Technology Stock Is a Better Buy in 2026? ↗
September 24, 2026


Figma Stock Analysis: Buy or Sell? ↗
September 15, 2026



Figma General Counsel Sells 109,000 Shares for $2.8 Million ↗
September 09, 2026

Why Figma Stock Climbed 13% in August ↗
September 02, 2026
Figma General Counsel Sells 211,599 Shares for $6.3 Million ↗
September 02, 2026
3 Contrarian Trades for a Market That Looks Too Hot ↗
August 25, 2026
Figma (FIG) Q2 2026 Earnings Call Transcript ↗
August 12, 2026
How Figma Stock Jumped 37.4% Last Month ↗
August 10, 2026

Figma Q2 Earnings Call Highlights ↗
August 08, 2026
Why Figma Stock Just Sank ↗
August 06, 2026
Frequently Asked Questions
Is Figma, Inc. Class A Common Stock publicly traded?
Yes, Figma, Inc. Class A Common Stock is publicly traded.
What exchange does Figma, Inc. Class A Common Stock trade on?
Figma, Inc. Class A Common Stock trades on the New York Stock Exchange
What is the ticker symbol for Figma, Inc. Class A Common Stock?
The ticker symbol for Figma, Inc. Class A Common Stock is FIG on the New York Stock Exchange
What is the current price of Figma, Inc. Class A Common Stock?
The current price of Figma, Inc. Class A Common Stock is 22.99
When was Figma, Inc. Class A Common Stock last traded?
The last trade of Figma, Inc. Class A Common Stock was at 10/15/26 07:00 PM ET