Market Indicators
World Markets
More


Sector ETFs
More Sectors| Sector | % Change | YTD % |
|---|---|---|
| Basic Materials | +1.40% |
+14.40% |
| Consumer Goods | -1.96% |
+12.94% |
| Energy | +0.51% |
+28.86% |
| Financial Services | +1.08% |
+2.79% |
| Healthcare | -1.50% |
+5.29% |
| Industrial | +1.02% |
+8.75% |
| Technology | +4.21% |
+18.53% |
| Telecom | +1.71% |
+18.62% |
| Utilities | -0.75% |
+3.27% |
Market News
View More
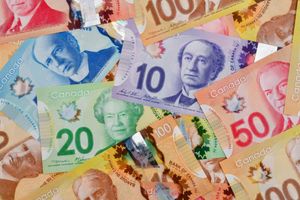
3 Canadian Dividend Stocks to Buy Before Inflation Bites Again ↗
Today 16:10 EDT

UFP Industries Q2 Earnings Call Highlights ↗
Today 16:04 EDT

Tetra Tech Q3 Earnings Call Highlights ↗
Today 16:04 EDT

Currencies
More Currencies


More News
View More


Stock Quote API & Stock News API supplied by www.cloudquote.io
Quotes delayed at least 20 minutes.
By accessing this page, you agree to the Privacy Policy and Terms Of Service.
Quotes delayed at least 20 minutes.
By accessing this page, you agree to the Privacy Policy and Terms Of Service.
© 2025 FinancialContent. All rights reserved.