Market Indicators
Market News
View More
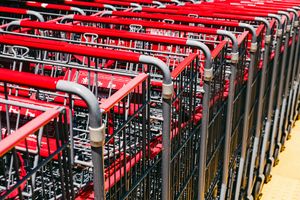
Is Costco Stock a Buy, Sell, or Hold in 2025?
Today 8:45 EDT

Should You Cash Out Your CD Early? Here's How to Tell
Today 8:30 EDT
Sector ETFs
More Sectors| Sector | % Change | YTD % |
|---|---|---|
| Basic Materials | +0.40% |
+11.48% |
| Consumer Goods | +0.46% |
+7.20% |
| Energy | +0.49% |
-2.04% |
| Financial Services | +1.00% |
+10.79% |
| Healthcare | +0.85% |
-6.03% |
| Industrial | +0.27% |
+7.62% |
| Technology | +0.99% |
+15.27% |
| Telecom | +0.73% |
+13.17% |
| Utilities | -0.39% |
+13.68% |


Currencies
More Currencies


More News
View More


Central Bank Unity Crumbles As Stagflation Fears Mount
Today 6:00 EDT


Stock Quote API & Stock News API supplied by www.cloudquote.io
Quotes delayed at least 20 minutes.
By accessing this page, you agree to the following
Privacy Policy and Terms Of Service.
Quotes delayed at least 20 minutes.
By accessing this page, you agree to the following
Privacy Policy and Terms Of Service.