Market Indicators
Market News
View More
Why Shares of Bullish Are Surging Today
Today 10:37 EDT

Should You Invest $1,000 in Media Giant Paramount Right Now?
Today 10:37 EDT

The Smartest Growth Stock to Buy With $1,000 Right Now
Today 10:34 EDT
Sector ETFs
More Sectors| Sector | % Change | YTD % |
|---|---|---|
| Basic Materials | -0.13% |
+15.31% |
| Consumer Goods | -0.80% |
+4.93% |
| Energy | -0.38% |
+2.58% |
| Financial Services | +0.47% |
+16.68% |
| Healthcare | +0.02% |
-0.99% |
| Industrial | +0.62% |
+9.61% |
| Technology | +1.70% |
+20.53% |
| Telecom | +0.38% |
+19.03% |
| Utilities | -0.09% |
+10.24% |


Currencies
More Currencies


More News
View More
Why Is CRWD Stock Rising Today?
Today 10:42 EDT


Earnings Outlook For Globus Maritime
Today 10:01 EDT
How Is The Market Feeling About Hims & Hers Health?
Today 10:00 EDT
A Look at MoneyHero's Upcoming Earnings Report
Today 10:00 EDT
P/E Ratio Insights for Pfizer
Today 10:00 EDT


Why Is Rigetti Computing Stock Rising Today?
Today 9:42 EDT
Why Is Ondas Stock Rising Today?
Today 9:38 EDT


12 Analysts Assess CarMax: What You Need To Know
Today 10:01 EDT
Breaking Down Tenet Healthcare: 13 Analysts Share Their Views
Today 10:01 EDT
6 Analysts Assess Roivant Sciences: What You Need To Know
Today 10:00 EDT
What's Driving the Market Sentiment Around Motorola Solutions?
Today 10:00 EDT

What Does the Market Think About Targa Resources?
Today 10:00 EDT
5 Analysts Have This To Say About Douglas Emmett
Today 10:00 EDT


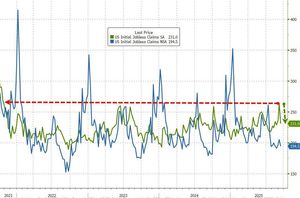
Nasdaq Surges 100 Points; US Initial Jobless Claims Fall
Today 9:59 EDT


Leading And Lagging Sectors For September 18, 2025
Today 9:10 EDT


Stock Quote API & Stock News API supplied by www.cloudquote.io
Quotes delayed at least 20 minutes.
By accessing this page, you agree to the following
Privacy Policy and Terms Of Service.
Quotes delayed at least 20 minutes.
By accessing this page, you agree to the following
Privacy Policy and Terms Of Service.