Market Indicators
Market News
View More
Why Rate Cuts May Not Put the Fizz Back in Pepsi’s Stock
Today 10:34 EDT

Bet on the Vegas Strip With This Income Stock
Today 10:11 EDT

Lovesac Q2 Sales Rise Snug Rollout Grows
Today 10:05 EDT
Sector ETFs
More Sectors| Sector | % Change | YTD % |
|---|---|---|
| Basic Materials | +0.83% |
+16.14% |
| Consumer Goods | +0.78% |
+7.34% |
| Energy | +0.03% |
+2.94% |
| Financial Services | +1.16% |
+15.50% |
| Healthcare | +1.16% |
+0.46% |
| Industrial | +0.96% |
+9.70% |
| Technology | +0.20% |
+17.68% |
| Telecom | +0.58% |
+19.46% |
| Utilities | +0.41% |
+11.79% |


Currencies
More Currencies


More News
View More

Instacart Teams Up With Vroom Delivery For Carrot Ads Rollout
Today 10:17 EDT
Why Did Micron Technology Stock Surge 8% Today?
Today 10:14 EDT


NVIDIA's Options Frenzy: What You Need to Know
Today 10:03 EDT
Demystifying BlackLine: Insights From 7 Analyst Reviews
Today 10:01 EDT

Dow Surges 1%; US Inflation Rate Accelerates
Today 10:15 EDT


Is RB Global Gaining or Losing Market Support?
Today 10:01 EDT
P/E Ratio Insights for BRF
Today 10:00 EDT
WLDS Stock Jumped 47% Today – Here’s Why
Today 9:37 EDT

Vera Bradley Revenue Falls 24 Percent
Today 9:08 EDT

A Glimpse Into The Expert Outlook On CRH Through 4 Analysts
Today 10:01 EDT
US Jobless Claims Rise To Highest Levels In Nearly 4 Years
Today 9:08 EDT
Looking Into Monday.Com's Recent Short Interest
Today 9:00 EDT
How Is The Market Feeling About Agree Realty?
Today 9:00 EDT
What's Driving the Market Sentiment Around Bank Bradesco?
Today 10:00 EDT
How Do Investors Really Feel About Super Micro Computer?
Today 10:00 EDT

What Does the Market Think About GE Aerospace?
Today 9:00 EDT
How To Trade SPY, Top Tech Stocks Using Technical Analysis
Today 8:56 EDT


Microsoft Expands Copilot AI To Sales, Service, And Finance
Today 8:45 EDT


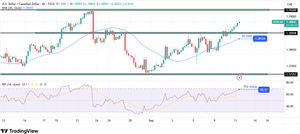
Elliott Wave: Dollar At Risk Ahead Of CPI And Fed Cut
Today 8:32 EDT


German Exports To US Fall To Lowest Level Since 2021
Today 9:12 EDT
Leading And Lagging Sectors For September 11, 2025
Today 9:10 EDT


4 Analysts Have This To Say About Lattice Semiconductor
Today 9:00 EDT
Expert Outlook: Doximity Through The Eyes Of 11 Analysts
Today 9:00 EDT


Stock Quote API & Stock News API supplied by www.cloudquote.io
Quotes delayed at least 20 minutes.
By accessing this page, you agree to the following
Privacy Policy and Terms Of Service.
Quotes delayed at least 20 minutes.
By accessing this page, you agree to the following
Privacy Policy and Terms Of Service.