Market Indicators
Market News
View More
D-Wave Quantum Skyrocketed Today. Is the Stock a Buy?
Today 18:45 EDT

OFG Bancorp Reports Record Q2 Results
Today 18:36 EDT

BigBear.ai Soared Again Today. Is the Stock a Buy?
Today 18:26 EDT
Sector ETFs
More Sectors| Sector | % Change | YTD % |
|---|---|---|
| Basic Materials | +0.80% |
+11.98% |
| Consumer Goods | +0.92% |
+7.99% |
| Energy | +0.63% |
-0.20% |
| Financial Services | +1.11% |
+11.85% |
| Healthcare | -1.14% |
-4.49% |
| Industrial | +0.92% |
+9.33% |
| Technology | +0.88% |
+12.00% |
| Telecom | +1.32% |
+10.83% |
| Utilities | +0.38% |
+8.82% |


Currencies
More Currencies


More News
View More
Archer Aviation Skyrocketed Today. Is the Stock a Buy Right Now?
Today 18:19 EDT


P/E Ratio Insights for Woori Financial Group
Today 18:00 EDT
A Look Into PACCAR Inc's Price Over Earnings
Today 17:00 EDT


Insteel Industries Fiscal Q3 Profit Jumps
Today 18:03 EDT


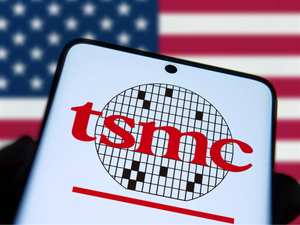
TSMC Earnings: AI Drives Demand
Today 17:52 EDT

Netflix: Strong Sales and Wider Margins
Today 17:39 EDT

Netflix (NFLX) Q2 2025 Earnings Call Transcript
Today 17:34 EDT

IBKR Q2 2025 Earnings Call Transcript
Today 17:30 EDT


Analyst Expectations For Marqeta's Future
Today 18:01 EDT

The Analyst Verdict: Evolent Health In The Eyes Of 5 Experts
Today 18:00 EDT


12 Health Care Stocks Moving In Thursday's After-Market Session
Today 17:06 EDT
12 Industrials Stocks Moving In Thursday's After-Market Session
Today 17:05 EDT


The Analyst Verdict: Apple In The Eyes Of 24 Experts
Today 17:01 EDT
Breaking Down Kimberly-Clark: 6 Analysts Share Their Views
Today 17:01 EDT
11 Analysts Assess Cognizant Tech Solns: What You Need To Know
Today 17:00 EDT
A Glimpse Into The Expert Outlook On Flywire Through 8 Analysts
Today 17:00 EDT


Stock Quote API & Stock News API supplied by www.cloudquote.io
Quotes delayed at least 20 minutes.
By accessing this page, you agree to the following
Privacy Policy and Terms Of Service.
Quotes delayed at least 20 minutes.
By accessing this page, you agree to the following
Privacy Policy and Terms Of Service.