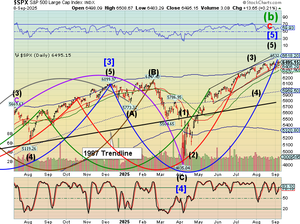
Market Indicators
Market News
View More
Joby's Stock Is Quiet, But a Storm of Catalysts Is Brewing
Today 10:44 EDT

Why Nebius Group Stock Went to the Moon Today
Today 10:30 EDT

Why Marvell Technology Tanked in August
Today 10:30 EDT
Sector ETFs
More Sectors| Sector | % Change | YTD % |
|---|---|---|
| Basic Materials | -1.25% |
+14.54% |
| Consumer Goods | +0.16% |
+6.66% |
| Energy | +1.66% |
+2.32% |
| Financial Services | +0.58% |
+14.41% |
| Healthcare | +0.29% |
+0.05% |
| Industrial | -1.07% |
+8.19% |
| Technology | -0.27% |
+15.15% |
| Telecom | 0.00% |
+17.10% |
| Utilities | +0.11% |
+9.18% |


Currencies
More Currencies


More News
View More

Quantum's Earnings Outlook
Today 10:02 EDT
Boeing's Options Frenzy: What You Need to Know
Today 10:02 EDT


Earnings Preview For Vince Holding
Today 10:02 EDT
A Look Ahead: Culp's Earnings Forecast
Today 10:02 EDT
Broadcom Unusual Options Activity
Today 10:01 EDT


Where Visteon Stands With Analysts
Today 10:01 EDT
Alliance Entertainment's Earnings Outlook
Today 10:01 EDT
Examining the Future: Energy Transfer's Earnings Outlook
Today 10:01 EDT


What 7 Analyst Ratings Have To Say About Lear
Today 10:01 EDT
Daktronics Earnings Preview
Today 10:01 EDT
Earnings Outlook For Oxford Industries
Today 10:00 EDT


Is Braskem Gaining or Losing Market Support?
Today 10:00 EDT
A Look Ahead: Lesaka Technologies's Earnings Forecast
Today 10:00 EDT


US Stocks Higher; Designer Brands Posts Upbeat Earnings
Today 10:23 EDT

What Does the Market Think About Robinhood Markets?
Today 10:00 EDT
Price Over Earnings Overview: Sanmina
Today 10:00 EDT
Earnings Outlook For Chewy
Today 10:00 EDT


Microsoft's Options: A Look at What the Big Money is Thinking
Today 10:02 EDT
The Analyst Verdict: Jakks Pacific In The Eyes Of 4 Experts
Today 10:01 EDT
Insights into Tsakos Energy Navigation's Upcoming Earnings
Today 10:01 EDT
What Analysts Are Saying About American Public Education Stock
Today 10:01 EDT
Analyst Expectations For Dianthus Therapeutics's Future
Today 10:01 EDT

How Is The Market Feeling About Catalyst Pharmaceuticals?
Today 10:00 EDT


Top 2 Tech Stocks That May Keep You Up At Night This Month
Today 9:23 EDT

Stock Quote API & Stock News API supplied by www.cloudquote.io
Quotes delayed at least 20 minutes.
By accessing this page, you agree to the following
Privacy Policy and Terms Of Service.
Quotes delayed at least 20 minutes.
By accessing this page, you agree to the following
Privacy Policy and Terms Of Service.