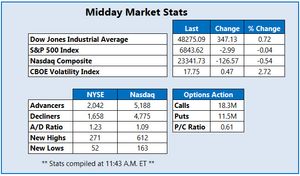
Market Indicators
World Markets
More


Sector ETFs
More Sectors| Sector | % Change | YTD % |
|---|---|---|
| Basic Materials | +1.65% |
+15.25% |
| Consumer Goods | +0.29% |
+4.75% |
| Energy | -0.92% |
+4.43% |
| Financial Services | +1.27% |
+16.58% |
| Healthcare | +1.37% |
+10.16% |
| Industrial | +0.66% |
+10.66% |
| Technology | -0.26% |
+27.12% |
| Telecom | +0.70% |
+20.53% |
| Utilities | -0.01% |
+16.47% |
Market News
View More
Papa John's $2.7 Billion Takeover Bid: A Price on Untapped Value
Today 12:39 EST


Why Hyliion Holdings Stock Is Sinking Today
Today 12:22 EST

Why BigBear.ai Stock Is Skyrocketing Today
Today 12:17 EST

This Growth Stock Is Down 35%. Buy or Wait?
Today 12:14 EST
Currencies
More Currencies


More News
View More


Is Qualcomm Up 40% or Down 20%? 2 Contrarian Takes
Today 11:46 EST


10 Industrials Stocks With Whale Alerts In Today's Session
Today 12:35 EST


4 Stocks To Consider Buying As Luxury Spending Keeps Rising
Today 12:21 EST


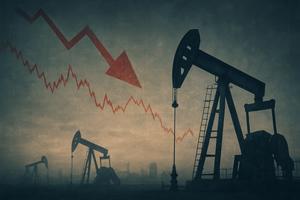
Crude Oil Dips 4%; On Holding Shares Jump After Q3 Earnings
Today 12:18 EST

Guardian Pharmacy Stock Pops on Q3 Strength and Upbeat Forecast
Today 11:18 EST


Endava Analysts Slash Their Forecasts Following Q1 Results
Today 12:09 EST


12 Health Care Stocks Moving In Wednesday's Intraday Session
Today 12:05 EST
12 Industrials Stocks Moving In Wednesday's Intraday Session
Today 12:05 EST


Examining the Future: DarioHealth's Earnings Outlook
Today 12:03 EST

Exploring Imunon's Earnings Expectations
Today 12:03 EST

Stock Quote API & Stock News API supplied by www.cloudquote.io
Quotes delayed at least 20 minutes.
By accessing this page, you agree to the Privacy Policy and Terms Of Service.
Quotes delayed at least 20 minutes.
By accessing this page, you agree to the Privacy Policy and Terms Of Service.
© 2025 FinancialContent. All rights reserved.