Market Indicators
Market News
View More


Sector ETFs
More Sectors| Sector | % Change | YTD % |
|---|---|---|
| Basic Materials | +0.28% |
+14.83% |
| Consumer Goods | +0.18% |
+4.44% |
| Energy | -1.84% |
+4.10% |
| Financial Services | +0.46% |
+16.19% |
| Healthcare | +0.30% |
-1.78% |
| Industrial | +0.39% |
+9.31% |
| Technology | +0.45% |
+22.17% |
| Telecom | +0.05% |
+18.79% |
| Utilities | +0.32% |
+14.43% |


Currencies
More Currencies


More News
View More

Wall Street’s New Playbook: Avoid These Sectors
Today 15:15 EDT


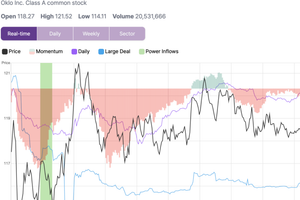
OKLO Shares Rise 4.9% To Intraday High After Power Inflow Signal
Today 16:08 EDT


Stock Quote API & Stock News API supplied by www.cloudquote.io
Quotes delayed at least 20 minutes.
By accessing this page, you agree to the following
Privacy Policy and Terms Of Service.
Quotes delayed at least 20 minutes.
By accessing this page, you agree to the following
Privacy Policy and Terms Of Service.