Market Indicators
Market News
View More
Why Sezzle Stock Tumbled 39% in August
Today 11:02 EDT


Why Lululemon Athletica Stock Crashed Today
Today 10:44 EDT
Sector ETFs
More Sectors| Sector | % Change | YTD % |
|---|---|---|
| Basic Materials | +0.09% |
+15.31% |
| Consumer Goods | +0.41% |
+7.53% |
| Energy | -2.02% |
+0.76% |
| Financial Services | -2.16% |
+13.23% |
| Healthcare | +0.35% |
-0.29% |
| Industrial | -0.99% |
+8.60% |
| Technology | -0.59% |
+13.94% |
| Telecom | -0.22% |
+18.10% |
| Utilities | -1.03% |
+9.48% |


Currencies
More Currencies


More News
View More

eGain Q4 Revenue Up With JPMorgan Win
Today 10:36 EDT

Market Highs And Attractive Setups Ahead
Today 11:04 EDT
Smart Money Is Betting Big In CRM Options
Today 11:03 EDT


Legend Biotech Considering Second Listing Outside US: Report
Today 11:02 EDT
How Is The Market Feeling About Alphabet?
Today 11:00 EDT
P/E Ratio Insights for ASE Technology Holding Co
Today 11:00 EDT


Looking Into Bloom Energy's Recent Short Interest
Today 11:00 EDT
Nukkleus Stock Just Shot Up 9% Today – Here’s Why
Today 11:00 EDT
Smith & Wesson Q1 Handgun Shipments Jump
Today 10:05 EDT

How Is The Market Feeling About Philip Morris Intl?
Today 11:00 EDT

Evaluating Microsoft Against Peers In Software Industry
Today 11:00 EDT
Insights into Mama's Creations's Upcoming Earnings
Today 10:03 EDT
Preview: Mission Produce's Earnings
Today 10:02 EDT
A Glimpse of Planet Labs's Earnings Potential
Today 10:02 EDT


Price Over Earnings Overview: Stride
Today 10:02 EDT
What's Driving the Market Sentiment Around Cava Group?
Today 10:00 EDT
24 Analysts Have This To Say About ON Semiconductor
Today 10:00 EDT


How Do Investors Really Feel About So-Young Intl?
Today 10:00 EDT


Top 2 Health Care Stocks That May Plunge This Month
Today 10:39 EDT


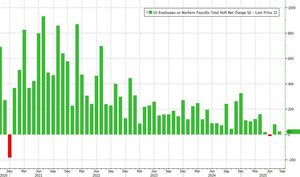
Dow Falls Over 100 Points; US Economy Adds 22,000 Jobs
Today 10:38 EDT


A Look at Casey's General Stores's Upcoming Earnings Report
Today 10:02 EDT


Stock Quote API & Stock News API supplied by www.cloudquote.io
Quotes delayed at least 20 minutes.
By accessing this page, you agree to the following
Privacy Policy and Terms Of Service.
Quotes delayed at least 20 minutes.
By accessing this page, you agree to the following
Privacy Policy and Terms Of Service.