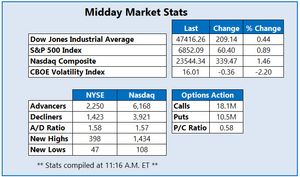
Market Indicators
World Markets
More


Sector ETFs
More Sectors| Sector | % Change | YTD % |
|---|---|---|
| Basic Materials | -0.79% |
+14.44% |
| Consumer Goods | -0.12% |
+5.85% |
| Energy | +0.19% |
+1.69% |
| Financial Services | +0.36% |
+14.70% |
| Healthcare | +0.07% |
+5.58% |
| Industrial | +0.28% |
+11.78% |
| Technology | +1.88% |
+29.68% |
| Telecom | +1.61% |
+21.92% |
| Utilities | -0.23% |
+18.86% |
Market News
View More

The Most Ethical Companies in America [2025 Survey]
Today 15:00 EDT


Earnings Outlook For New Gold
Today 15:03 EDT
Earnings Outlook For Centerra Gold
Today 15:02 EDT
Currencies
More Currencies


More News
View More
Earnings Outlook For New Gold
Today 15:03 EDT
Earnings Outlook For Centerra Gold
Today 15:02 EDT
Varonis Systems's Earnings Outlook
Today 15:02 EDT


A Glimpse of HNI's Earnings Potential
Today 15:02 EDT
This Is What Whales Are Betting On F5
Today 15:01 EDT


P/E Ratio Insights for Freshpet
Today 15:00 EDT

Why China Is On A Pace To Win The AI Race
Today 15:00 EDT
GSK Buys Global Rights To Preclinical Cancer Therapy For $357M
Today 14:46 EDT


The Next Couple Of Years For The Job Market Could Be Tough
Today 14:04 EDT


What to Expect from Zurn Elkay Water's Earnings
Today 14:03 EDT


InvenTrust Properties's Earnings: A Preview
Today 14:03 EDT
Earnings Preview: Group 1 Automotive
Today 14:02 EDT
Insights Ahead: Cheesecake Factory's Quarterly Earnings
Today 15:02 EDT
Examining the Future: Kadant's Earnings Outlook
Today 15:02 EDT
Uncovering Potential: Highwoods Props's Earnings Preview
Today 15:02 EDT
Examining the Future: Enphase Energy's Earnings Outlook
Today 15:01 EDT
What to Expect from Caesars Entertainment's Earnings
Today 15:01 EDT
Uncovering Potential: Arcutis Biotherapeutics's Earnings Preview
Today 15:01 EDT
A Peek at Four Corners Property's Future Earnings
Today 14:02 EDT
Earnings Outlook For Chemed
Today 14:02 EDT
Earnings Outlook For Element Solutions
Today 14:01 EDT
What to Expect from Kiniksa Pharmaceuticals's Earnings
Today 15:01 EDT
Peering Into Eli Lilly and Co's Recent Short Interest
Today 15:00 EDT
How Is The Market Feeling About StoneX Group Inc?
Today 15:00 EDT
Is the Market Bullish or Bearish on Generac Holdings Inc?
Today 15:00 EDT


A Peek at VSE's Future Earnings
Today 14:01 EDT
GeneDx Hldgs's Earnings: A Preview
Today 14:01 EDT


Is the Market Bullish or Bearish on Aramark?
Today 14:00 EDT


Amazon Earnings: What’s Needed for a Breakout to New Highs?
Today 13:25 EDT


Stock Quote API & Stock News API supplied by www.cloudquote.io
Quotes delayed at least 20 minutes.
By accessing this page, you agree to the Privacy Policy and Terms Of Service.
Quotes delayed at least 20 minutes.
By accessing this page, you agree to the Privacy Policy and Terms Of Service.
© 2025 FinancialContent. All rights reserved.