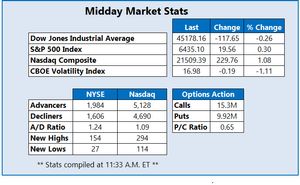
Market Indicators
Market News
View More
The Problem With Weight Loss Stocks
Today 13:48 EDT

Why Newegg Commerce Stock Fell 34.3% Last Month
Today 13:44 EDT

Sector ETFs
More Sectors| Sector | % Change | YTD % |
|---|---|---|
| Basic Materials | -0.22% |
+15.11% |
| Consumer Goods | -1.01% |
+6.74% |
| Energy | -2.04% |
+2.21% |
| Financial Services | -0.99% |
+13.54% |
| Healthcare | -0.83% |
-1.42% |
| Industrial | -0.92% |
+7.99% |
| Technology | +0.49% |
+13.34% |
| Telecom | -0.45% |
+15.99% |
| Utilities | -0.67% |
+10.21% |


Currencies
More Currencies


More News
View More
This Is What Whales Are Betting On Spotify Technology
Today 13:01 EDT


Chevron's Options Frenzy: What You Need to Know
Today 13:01 EDT


Axon Enterprise's Options Frenzy: What You Need to Know
Today 13:01 EDT
What's Driving the Market Sentiment Around GSK?
Today 13:00 EDT


Is the Market Bullish or Bearish on Heico?
Today 13:00 EDT


Macy's (M) Q2 2025 Earnings Call Transcript
Today 12:41 EDT


10 Industrials Stocks With Whale Alerts In Today's Session
Today 13:35 EDT
10 Financials Stocks With Whale Alerts In Today's Session
Today 13:35 EDT


Macy's Q2 Sales Beat Guidance
Today 12:33 EDT


J.Jill Reports Q2 Sales of $154 Million
Today 12:21 EDT


Campbell Soup Lifts Cost Savings Target
Today 12:10 EDT


Stock Quote API & Stock News API supplied by www.cloudquote.io
Quotes delayed at least 20 minutes.
By accessing this page, you agree to the following
Privacy Policy and Terms Of Service.
Quotes delayed at least 20 minutes.
By accessing this page, you agree to the following
Privacy Policy and Terms Of Service.