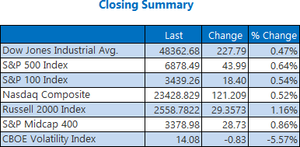
Market Indicators
World Markets
More


Sector ETFs
More Sectors| Sector | % Change | YTD % |
|---|---|---|
| Basic Materials | +1.72% |
+21.68% |
| Consumer Goods | +0.10% |
+2.79% |
| Energy | +1.14% |
+2.08% |
| Financial Services | +1.34% |
+20.26% |
| Healthcare | +0.72% |
+12.19% |
| Industrial | +1.00% |
+13.14% |
| Technology | +0.57% |
+25.90% |
| Telecom | +1.16% |
+26.22% |
| Utilities | +0.52% |
+11.67% |
Market News
View More
Why Uniswap Surged More than 12% This Weekend ↗
Today 16:46 EST

Is It Time to Take Profits on These 2025 Winners? ↗
Today 16:33 EST
SCHD vs. NOBL: Different Paths to Dividend Stability ↗
Today 16:31 EST

Hi Ho Silver ↗
Today 16:54 EST
Currencies
More Currencies


More News
View More


Pentagon Inks Deal With Elon Musk’s xAI ↗
Today 15:59 EST


Could These 3 Aerospace Firms Go Stratospheric in 2026? ↗
Today 15:43 EST


3 Reasons Palantir Is Unavoidable in AI Infrastructure by 2026 ↗
Today 14:34 EST


Stock Quote API & Stock News API supplied by www.cloudquote.io
Quotes delayed at least 20 minutes.
By accessing this page, you agree to the Privacy Policy and Terms Of Service.
Quotes delayed at least 20 minutes.
By accessing this page, you agree to the Privacy Policy and Terms Of Service.
© 2025 FinancialContent. All rights reserved.