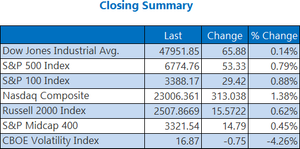
Market Indicators
World Markets
More


Sector ETFs
More Sectors| Sector | % Change | YTD % |
|---|---|---|
| Basic Materials | +0.09% |
+18.55% |
| Consumer Goods | -0.63% |
+3.09% |
| Energy | -1.40% |
+0.85% |
| Financial Services | -0.08% |
+17.92% |
| Healthcare | -0.05% |
+10.56% |
| Industrial | +0.59% |
+10.98% |
| Technology | +1.56% |
+22.85% |
| Telecom | +1.11% |
+22.14% |
| Utilities | +0.92% |
+12.49% |
Market News
View More
Why ABM Industries Stock Sagged by Almost 10% Today ↗
Today 20:11 EST

This "Magnificent Seven" Company May Now Be Winning the AI War ↗
Today 19:52 EST


Currencies
More Currencies


More News
View More


Price Over Earnings Overview: Sherwin-Williams ↗
Today 17:00 EST


Stock Quote API & Stock News API supplied by www.cloudquote.io
Quotes delayed at least 20 minutes.
By accessing this page, you agree to the Privacy Policy and Terms Of Service.
Quotes delayed at least 20 minutes.
By accessing this page, you agree to the Privacy Policy and Terms Of Service.
© 2025 FinancialContent. All rights reserved.