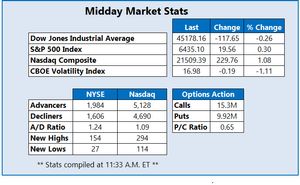
Market Indicators
Market News
View More
Taiwan Semiconductor Falls on China News—Buy The Dip?
Today 14:32 EDT


Why Figma Stock Lost 39% in August
Today 13:55 EDT
Sector ETFs
More Sectors| Sector | % Change | YTD % |
|---|---|---|
| Basic Materials | -0.22% |
+15.11% |
| Consumer Goods | -0.74% |
+7.03% |
| Energy | -2.08% |
+2.17% |
| Financial Services | -0.88% |
+13.67% |
| Healthcare | -0.65% |
-1.24% |
| Industrial | -0.82% |
+8.10% |
| Technology | +0.51% |
+13.36% |
| Telecom | -0.37% |
+16.08% |
| Utilities | -0.49% |
+10.41% |


Currencies
More Currencies


More News
View More


Fed’s Kashkari Cautions Tariffs Emerging As Inflation Driver
Today 14:22 EDT


Looking Into SentinelOne's Recent Short Interest
Today 14:00 EDT


What Does the Market Think About SoFi Technologies?
Today 14:00 EDT
Is Accenture Gaining or Losing Market Support?
Today 14:00 EDT


A Look Into Rambus Inc's Price Over Earnings
Today 14:00 EDT


6 Analysts Assess Patterson-UTI Energy: What You Need To Know
Today 14:01 EDT
Beyond The Numbers: 10 Analysts Discuss CoStar Group Stock
Today 14:01 EDT
Assessing Rithm Capital: Insights From 5 Financial Analysts
Today 14:00 EDT
What 5 Analyst Ratings Have To Say About Hyatt Hotels
Today 14:00 EDT


Macy's (M) Q2 2025 Earnings Call Transcript
Today 12:41 EDT


Stock Quote API & Stock News API supplied by www.cloudquote.io
Quotes delayed at least 20 minutes.
By accessing this page, you agree to the following
Privacy Policy and Terms Of Service.
Quotes delayed at least 20 minutes.
By accessing this page, you agree to the following
Privacy Policy and Terms Of Service.