Market Indicators
Market News
View More


Sector ETFs
More Sectors| Sector | % Change | YTD % |
|---|---|---|
| Basic Materials | -2.25% |
+13.11% |
| Consumer Goods | +0.63% |
+4.72% |
| Energy | -2.93% |
-1.58% |
| Financial Services | -2.41% |
+11.03% |
| Healthcare | -1.68% |
+2.62% |
| Industrial | -2.30% |
+7.27% |
| Technology | -3.89% |
+20.84% |
| Telecom | -2.39% |
+19.47% |
| Utilities | -0.42% |
+17.84% |


Currencies
More Currencies


More News
View More
Analyst Expectations For Associated Banc's Future
Today 18:01 EDT
P/E Ratio Insights for TJX Companies
Today 18:00 EDT


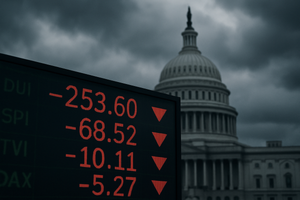
Stocks Secure Weekly Losses With Sharp Friday Selloff
Today 17:47 EDT


What 4 Analyst Ratings Have To Say About Stoke Therapeutics
Today 18:01 EDT

6 Analysts Have This To Say About PPG Indus
Today 18:00 EDT


Why Did Oklo Stock Pop Today?
Today 16:48 EDT


Stock Quote API & Stock News API supplied by www.cloudquote.io
Quotes delayed at least 20 minutes.
By accessing this page, you agree to the following
Privacy Policy and Terms Of Service.
Quotes delayed at least 20 minutes.
By accessing this page, you agree to the following
Privacy Policy and Terms Of Service.