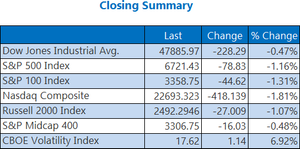
Market Indicators
World Markets
More


Sector ETFs
More Sectors| Sector | % Change | YTD % |
|---|---|---|
| Basic Materials | +0.50% |
+18.44% |
| Consumer Goods | +0.43% |
+3.75% |
| Energy | +2.06% |
+2.28% |
| Financial Services | -0.03% |
+18.01% |
| Healthcare | -0.14% |
+10.61% |
| Industrial | -1.34% |
+10.33% |
| Technology | -2.11% |
+20.97% |
| Telecom | -0.82% |
+20.81% |
| Utilities | -0.69% |
+11.47% |
Market News
View More

Could These 5 AI ETFs More Than Double Your Money in 5 Years? ↗
Today 18:50 EST


Market Talk - Wednesday, Dec. 17 ↗
Today 18:19 EST
Currencies
More Currencies


More News
View More


The Selloff That Isn't A Selloff ↗
Today 18:13 EST

P/E Ratio Insights for ONEOK ↗
Today 17:00 EST


Why a SpaceX IPO Could Be a Major Catalyst for GOOGL Stock ↗
Today 16:53 EST


Stock Quote API & Stock News API supplied by www.cloudquote.io
Quotes delayed at least 20 minutes.
By accessing this page, you agree to the Privacy Policy and Terms Of Service.
Quotes delayed at least 20 minutes.
By accessing this page, you agree to the Privacy Policy and Terms Of Service.
© 2025 FinancialContent. All rights reserved.