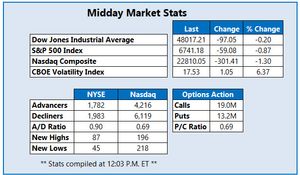
Market Indicators
World Markets
More


Sector ETFs
More Sectors| Sector | % Change | YTD % |
|---|---|---|
| Basic Materials | +0.68% |
+18.65% |
| Consumer Goods | +0.16% |
+3.48% |
| Energy | +1.21% |
+1.43% |
| Financial Services | +0.27% |
+18.37% |
| Healthcare | +0.17% |
+10.95% |
| Industrial | -1.01% |
+10.70% |
| Technology | -1.27% |
+22.01% |
| Telecom | -0.26% |
+21.49% |
| Utilities | -0.94% |
+11.19% |
Market News
View More


Currencies
More Currencies


More News
View More
10 Financials Stocks Whale Activity In Today's Session ↗
Today 12:35 EST

Visa: Completing Correction, Upside Potential Ahead ↗
Today 12:28 EST


Unpacking the Latest Options Trading Trends in Wells Fargo ↗
Today 12:00 EST


Why Did Processa Pharmaceuticals Stock Surge 160% Today? ↗
Today 11:36 EST

Intel Snaps Up AI Tech for Pennies on the Dollar ↗
Today 12:47 EST


Crude Oil Rises Over 1%; General Mills Earnings Top Views ↗
Today 12:02 EST

Costco Wholesale Unusual Options Activity ↗
Today 12:01 EST
How Do Investors Really Feel About Lockheed Martin Corp? ↗
Today 12:00 EST
P/E Ratio Insights for United Airlines Holdings ↗
Today 12:00 EST


Stock Quote API & Stock News API supplied by www.cloudquote.io
Quotes delayed at least 20 minutes.
By accessing this page, you agree to the Privacy Policy and Terms Of Service.
Quotes delayed at least 20 minutes.
By accessing this page, you agree to the Privacy Policy and Terms Of Service.
© 2025 FinancialContent. All rights reserved.