Market Indicators
World Markets
More


Sector ETFs
More Sectors| Sector | % Change | YTD % |
|---|---|---|
| Basic Materials | +0.12% |
+14.32% |
| Consumer Goods | -1.74% |
+3.35% |
| Energy | +0.80% |
+1.58% |
| Financial Services | -0.62% |
+13.58% |
| Healthcare | -0.20% |
+4.83% |
| Industrial | +0.01% |
+11.43% |
| Technology | +0.82% |
+32.28% |
| Telecom | -0.15% |
+22.44% |
| Utilities | +0.12% |
+17.39% |
Market News
View More
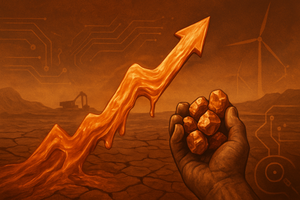
Natixis Declares Gold's New $3,000 Floor Amidst Unlikely Test
Today 13:25 EDT


Currencies
More Currencies


More News
View More

Preview: Estee Lauder Cos's Earnings
Today 13:02 EDT
An Overview of DexCom's Earnings
Today 13:02 EDT


Earnings Outlook For DT Midstream
Today 13:02 EDT
Cardinal Health's Earnings: A Preview
Today 13:02 EDT
Earnings Outlook For Zillow Gr
Today 13:01 EDT


Zillow Gr's Earnings Outlook
Today 13:01 EDT
Earnings Preview: Weyerhaeuser
Today 13:01 EDT
ON Semiconductor Unusual Options Activity
Today 13:01 EDT


UPS: From Discount to Delivery—Why Analysts May Turn Bullish
Today 12:37 EDT


A Preview Of Edwards Lifesciences's Earnings
Today 13:03 EDT
Earnings Outlook For Cheniere Energy Partners
Today 13:02 EDT
Examining the Future: Biogen's Earnings Outlook
Today 13:02 EDT

Unpacking the Latest Options Trading Trends in Shopify
Today 13:01 EDT
Looking At Alibaba Gr Hldgs's Recent Unusual Options Activity
Today 13:01 EDT

Stock Quote API & Stock News API supplied by www.cloudquote.io
Quotes delayed at least 20 minutes.
By accessing this page, you agree to the Privacy Policy and Terms Of Service.
Quotes delayed at least 20 minutes.
By accessing this page, you agree to the Privacy Policy and Terms Of Service.
© 2025 FinancialContent. All rights reserved.