Market Indicators
World Markets
More


Sector ETFs
More Sectors| Sector | % Change | YTD % |
|---|---|---|
| Basic Materials | +1.03% |
+13.38% |
| Consumer Goods | +1.44% |
+4.44% |
| Energy | +1.17% |
+5.40% |
| Financial Services | +0.40% |
+15.11% |
| Healthcare | +2.31% |
+8.67% |
| Industrial | +0.19% |
+9.94% |
| Technology | -0.73% |
+27.45% |
| Telecom | +0.47% |
+19.70% |
| Utilities | +0.12% |
+16.49% |
Market News
View More

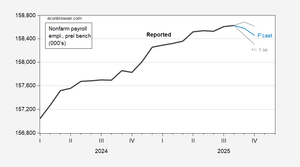
Guessing NFP Growth
Today 15:14 EST

Pulmonx's Earnings: A Preview
Today 15:03 EST

P/E Ratio Insights for AT&T
Today 15:00 EST
Currencies
More Currencies


More News
View More
Pulmonx's Earnings: A Preview
Today 15:03 EST
P/E Ratio Insights for AT&T
Today 15:00 EST


P/E Ratio Insights for Northrop Grumman
Today 16:00 EST


Stock Quote API & Stock News API supplied by www.cloudquote.io
Quotes delayed at least 20 minutes.
By accessing this page, you agree to the Privacy Policy and Terms Of Service.
Quotes delayed at least 20 minutes.
By accessing this page, you agree to the Privacy Policy and Terms Of Service.
© 2025 FinancialContent. All rights reserved.