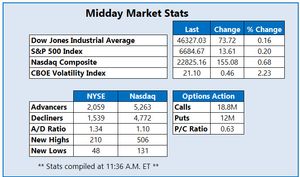
Market Indicators
Market News
View More


Sector ETFs
More Sectors| Sector | % Change | YTD % |
|---|---|---|
| Basic Materials | -0.56% |
+15.12% |
| Consumer Goods | +0.06% |
+5.04% |
| Energy | -1.83% |
-2.06% |
| Financial Services | -2.63% |
+11.08% |
| Healthcare | -0.15% |
+2.83% |
| Industrial | -1.20% |
+8.06% |
| Technology | -0.61% |
+22.47% |
| Telecom | -1.02% |
+21.85% |
| Utilities | -0.80% |
+19.89% |


Currencies
More Currencies


More News
View More
Tesla Analysts Voice Concerns On Fundamentals, High Valuation
Today 14:03 EDT


Smart Money Is Betting Big In Bloom Energy Options
Today 14:01 EDT
Where Meta Platforms Stands With Analysts
Today 14:01 EDT


Apple Bets On Bundling As Peacock Pact Cuts Streaming Costs
Today 13:56 EDT

President and CEO of EBAY Sells 14K Shares for $1.3 Million
Today 13:37 EDT


Assessing Quanta Services: Insights From 13 Financial Analysts
Today 14:01 EDT
Expert Outlook: Clean Harbors Through The Eyes Of 7 Analysts
Today 14:01 EDT
Amazon.com's Options Frenzy: What You Need to Know
Today 14:01 EDT
Where HIVE Digital Technologies Stands With Analysts
Today 14:00 EDT
Is SoFi Technologies Inc Gaining or Losing Market Support?
Today 14:00 EDT
Deep Dive Into SLB Stock: Analyst Perspectives (5 Ratings)
Today 14:00 EDT
Is Mirion Technologies Inc Gaining or Losing Market Support?
Today 14:00 EDT
What's Driving the Market Sentiment Around Lockheed Martin Corp?
Today 14:00 EDT
7 Analysts Assess Canadian Solar: What You Need To Know
Today 14:00 EDT
A Look Into Infosys Inc's Price Over Earnings
Today 14:00 EDT


10 Industrials Stocks Whale Activity In Today's Session
Today 13:35 EDT
10 Financials Stocks With Whale Alerts In Today's Session
Today 13:35 EDT


Under the Radar: How to Find the Market's Hidden Gems
Today 13:29 EDT


Stock Quote API & Stock News API supplied by www.cloudquote.io
Quotes delayed at least 20 minutes.
By accessing this page, you agree to the Privacy Policy and Terms Of Service.
Quotes delayed at least 20 minutes.
By accessing this page, you agree to the Privacy Policy and Terms Of Service.
© 2025 FinancialContent. All rights reserved.